Key Events
- US CPI (y/y, m/m, and core) - Wednesday
- Declining Energy Prices: Easing pressure on monetary policy and inflation
- Trump Effect: Notable highs in US indices, Bitcoin, and the US Dollar
- Sector Outperformance: Consumer goods, utilities, and financials driving Dow’s record highs
- FOMC Member Remarks: Insights on monetary policy on Tuesday and Wednesday
- Powell’s Remarks: Friday at the Global Perspectives Panel
US CPI and Fed’s Easing Cycle
Source: CME Fed Watch Tool
This week, the CME Fed Watch Tool is in focus as markets anticipate new US CPI data on Wednesday, with a 25-bps rate cut for December priced within a target range of 4.25%–4.75%. The latest FOMC meeting emphasized the Fed’s steady approach to the easing cycle, aiming for maximum employment and a 2% inflation target. Lower energy prices, alongside deflationary pressures from China and Trump’s policy agenda, are expected to ease inflation, potentially supporting the uptrend in US indices.
Upside risk for energy prices and downside risks for indices remain in the background with developing geopolitical conflicts.
FOMC Members and Powell Insights
Following last week’s FOMC meeting and the elections, the Dow closed the week at a record high above 44,000. FOMC members Musalim, Schmid, and Barkin are scheduled to share their insights this week, potentially impacting market volatility.
Fed Chair Powell’s insights are anticipated on Friday, with a focus on post-CPI data risks that could move the market.
Technical Analysis: Quantifying Uncertainties
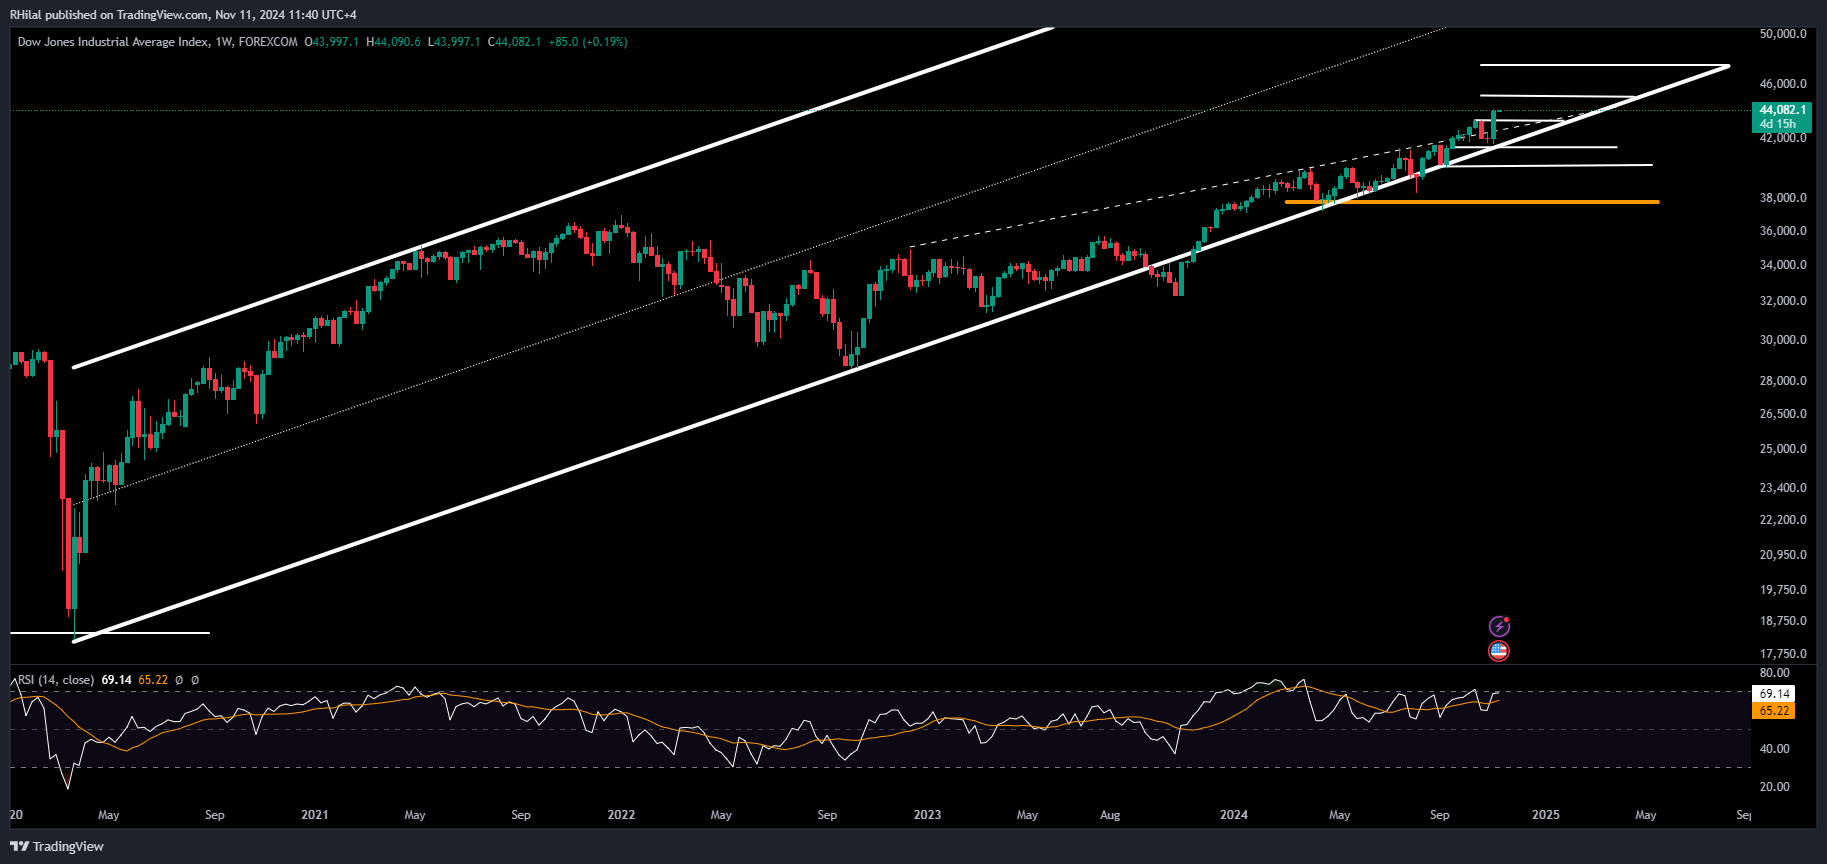
Dow Jones Forecast: Weekly Time Frame – Log Scale

Source: Tradingview
The Dow’s uptrend, originating from the October 2022 low, has intensified, pushing beyond the trendline connecting consecutive highs from 2022 to 2024. The index continues to respect the support established between the 2020 and 2022 lows, reaching record levels above 44,000.
Fibonacci extension analysis, based on the March 2020 low (18,170), January 2022 high (36,955), and October 2022 low (28,629), highlights possible resistance as follows:
- Short-term Resistance: 44,150 and 45,000
- Long-term Resistance: 45,200 and 47,200
Potential pullbacks could be supported along the 2020-2022 trendline, with primary bull trend support levels as follows:
- Short-term Support: 43,600, 43,300, and 43,000
- Long-term Support: 41,600, 40,000, and 37,800
— Written by Razan Hilal, CMT – on X: @Rh_waves


