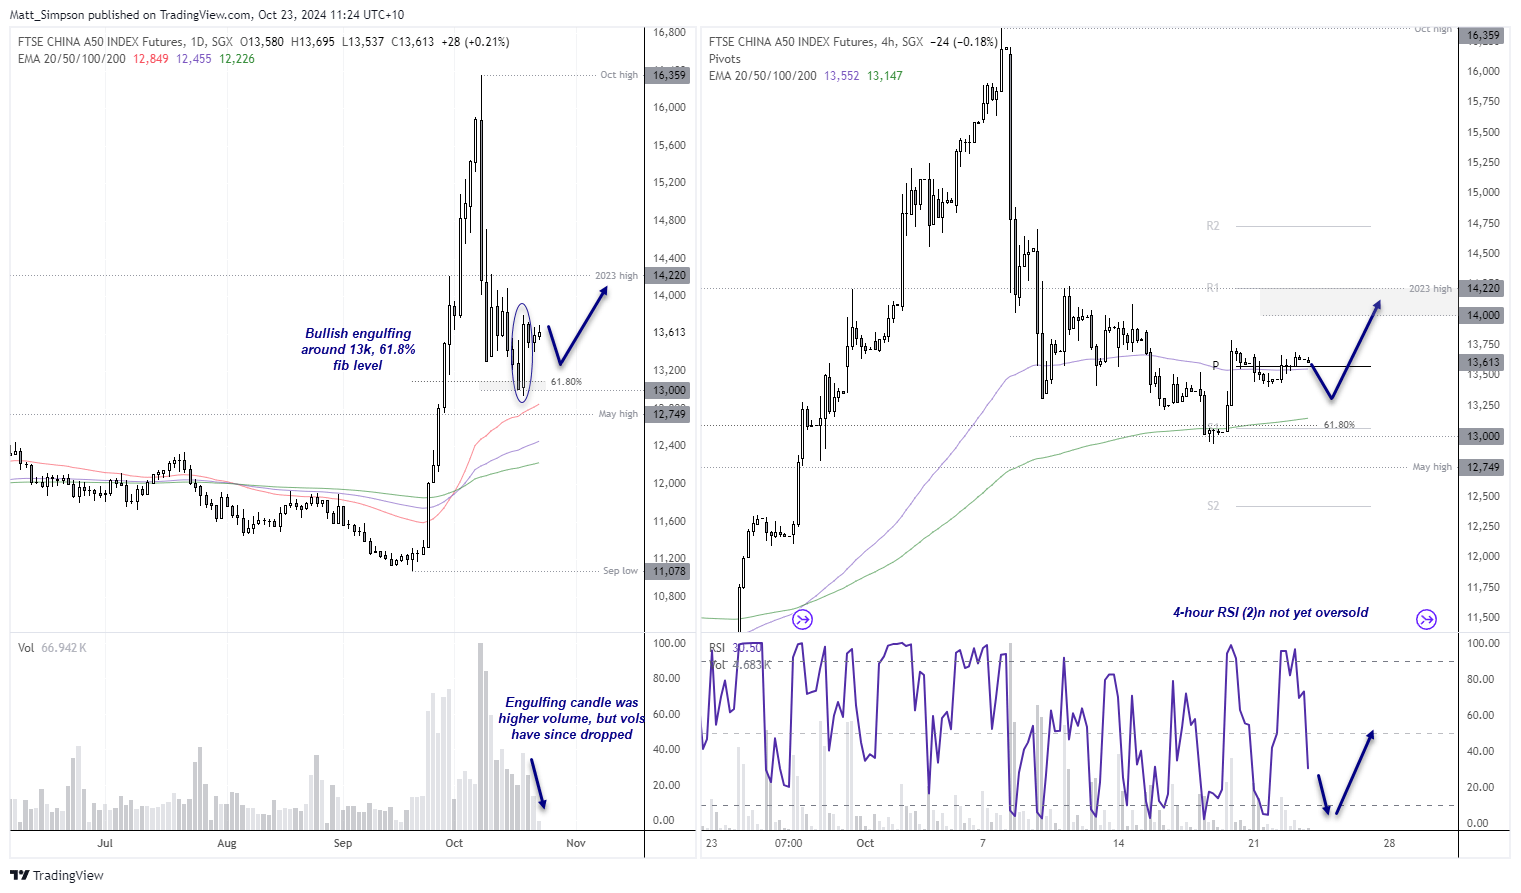
Wall Street indices may be around their record highs, yet the Dow Jones has been knocked from its perch and considering its next leg lower. Yet I suspect buyers are lurking around the China A50 in anticipation of its next leg higher.
Dow Jones technical analysis:
The recent outperformer on Wall Street is having second thoughts this week, with the Dow Jones now considering a break beneath its 43k level. A 3-star bearish reversal pattern has formed on the daily chart (evening star), and a lower high has since formed on the 4-hour chart.
A dark cloud cover also formed on the 4-hour chart, with its high respecting a prior support level at 43,288. A break beneath the 42,937 low assumes bearish continuation and brings the 42,587 low into focus near a 61.8% Fibonacci ratio.
Note that the 4-hour RSI (14) formed a bearish divergence ahead of the 3-day reversal, and has since confirmed the move lower. It has also yet to reach oversold, hence the bias for at least one more leg lower.

China A50 futures technical analysis:
The rally from the September low to October high was nothing short of impressive, having risen just shy of 50% in under three weeks. News of stimulus ahead of golden week was the news speculators had been waiting for, so much that many of seemed to be more focussed on buying more stocks during the holiday period over spending time with family.
Yet when cash markets reopened, traders were quick to book profits when it was revealed no further stimulus was imminent, resulting in a -21% retracement. This technically places the China A50 into a bear market, even if only just.
Still, buyers resurfaced around 13,000 and the monthly pivot point, allowing the China A50 market to form a prominent bullish engulfing day around the 61.8% Fibonacci level. The bullish candle was also on higher volume to suggest initiative buying.

- Bulls could seek dips within the bullish engulfing candle, in anticipation for a rise to at least 14,000 or the 2023 high (14,220)
- A initial minor retracement lower also seems likely given lower volumes since the bullish engulfing day
- We may need to wait for the 4-hour RSI (2) to dip into oversold before a swing low is formed and bullish momentum returns
-- Written by Matt Simpson
Follow Matt on Twitter @cLeverEdge


