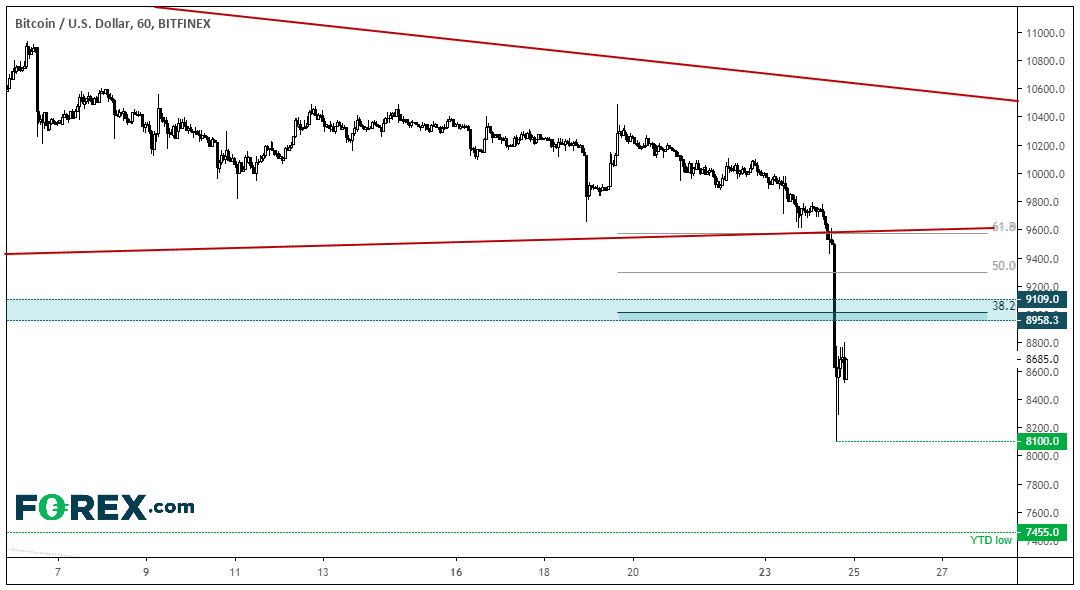
Crypto Bears Resurface, Bitcoin Plummets 20%
Crypto currencies went into freefall earlier today, with Bitcoin falling over 20% at the low of the session.

Now, these are my own observations and cannot say for sure the following element are connected. Yet I cannot help but notice that crypto sold off heavily following the announcement of impeachment proceedings whilst stocks were in freefall. This is the complete opposite you’d for Bitcoin which has been touted as a digital safe-haven currency. But, more interestingly, Bitcoin’s safe-haven appeal appears to have diminished since CNY broke above 7. Again, not sure if these elements are connected but the sequence of events have caught my attention. But is certainly something to consider going forward whilst CNY remains weak and Trump struggles to fight a trade war (or generally do anything) whilst he’s hampered by impeachment proceedings.
Closing the session down a casual -12%, it’s not been a great day for the Bitcoin bull camp. From a technical standpoint, it’s broken to the downside of the symmetrical triangle and sliced through the $9k support zone like butter. Moreover, it was a high-volume bearish session which suggests it’s not a low-liquidity glitch and there could be further losses to come.
Now we’ve not seen a daily range at or above 20% since the end of June, which was one day after its 2019 peak. And subsequent price action has played out as suggested in prior analysis.
“Flicking back through the chart, these levels of volatility [at or above 20% daily ranges] have generally been associated with, downtrends, deep corrections or periods ahead of a crash”.
So, for now, we’ll stick with the bearish channel thesis which could indeed bottom out before the bullish trend resumes.
Switching to the hourly chart, prices are behaving in the usual shell-shocked fashion we’d expect after an explosive move. The market needs to catch a breath, and price action may not play so nicely over the near-term.
- Bears could seek a dead-cat bounce and look to enter when volatility has subsided. Or see if resistance holds around $9k which was prior support and where the 38.2% Fibonacci level resides.
- Alternatively, if a deeper retracement unfolds, traders could look to see if the lower triangle holds as resistance around the 61.8% Fibonacci level holds. Although that would be one to consider on a higher timeframe such as the daily or perhaps the four-hour chart.
- The 8,100 low is the initial target, a break of which confirms bearish resumption of the trend. The YTD low at 7,455 and the lower channel then come into focus for bears.


