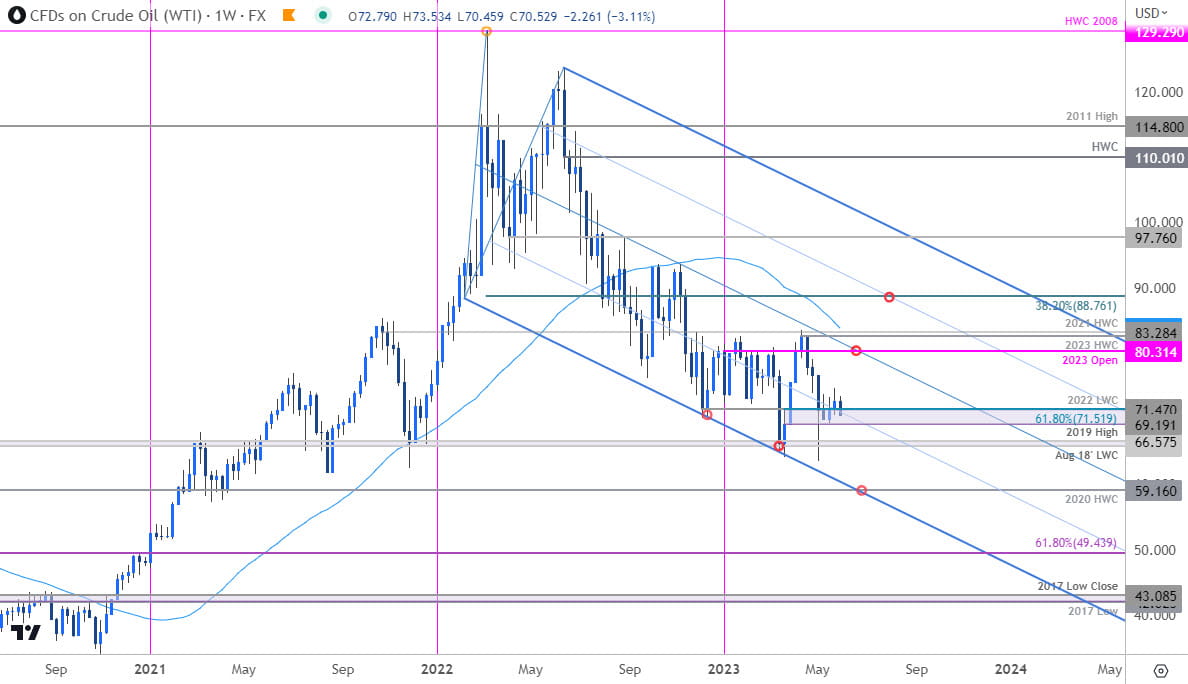
Crude Oil Technical Forecast: WTI Weekly Trade Levels
- Crude testing critical support zone for firth week
- Risk for possible inflection into monthly close / June open
- WTI resistance 75.91, 80.31, 82.68-83.85- support 69.19-71.51 (key), 65.92-66.57, 59.16
Crude oil prices plunged more than 3% into the open with WTI testing make-or-break support for fifth conservative week. The focus remains on possible inflection here into the close of the month. These are the updated targets and invalidation levels that matter on the oil weekly technical charts heading into June trade.
Review my latest Weekly Strategy Webinar for an in-depth breakdown of this crude oil setup and more. Join live on Monday’s at 8:30am EST.
Crude Oil Price Chart – WTI Weekly

Chart Prepared by Michael Boutros, Technical Strategist; WTI on TradingView
Technical Outlook: In my last Crude Oil price forecast we noted that WTI had turned from downtrend resistance with the decline approaching a critical support zone at, “at 69.19-71.51 – a region defined by the yearly low-week reversal close, the 2022 low-week close, and the 61.8% Fibonacci retracement of the objective yearly range." Oil plunged lower the following week and while a fresh yearly low as registered intra-week, price failed to mark a weekly close below. WTI has now held this range for nearly five weeks – it’s the moment of truth as the bears make another attempt early in the week.
A break below this key threshold exposes another pivot zone at the August 2018 low-week close / 2023 low-close / 2019 high at 65.92-66.57 – a break / weekly close below this region is needed to mark resumption of the broader downtrend towards slope support around the 2020 high-week close at 59.16- an area of interest for possible price exhaustion / inflection IF reached.
Initial resistance stands near the 61.8% retracement of the new yearly range (April decline / not depicted) at 75.92 backed by the objective yearly open at 80.31. Ultimately, a breach / close above the 2023 / 2021 high-week closes and the 52-week moving average at 82.68-83.85 is needed to validate a breakout of the yearly opening-range towards 88.76.
Bottom line: Crude oil prices have been sitting at support all month and the focus is on possible price inflection into this zone. From a trading standpoint, a good region to reduce portions of short-exposure / lower protective stops with a weekly close below 69.19 needed to mark resumption of the broader downtrend. Keep in mind we are heading into the close of the month and the threat of some sort of washout rises into the June open. I’ll publish an updated crude oil short-term outlook once we get further clarity on the near-term WTI technical trade levels.
Active Weekly Technical Charts
- Canadian Dollar (USD/CAD)
- S&P 500, Nasdaq, Dow Jones
- Euro (EUR/USD)
- Japanese Yen (USD/JPY)
- Australian Dollar (AUD/USD)
- US Dollar (DXY)
- Gold (XAU/USD)
- British Pound (GBP/USD)
--- Written by Michael Boutros, Sr Technical Strategist with FOREX.com
Follow Michael on Twitter @MBForex


