- Nat Gas is facing yearly highs
- Crude Oil is up near $78
- OPEC monthly report growth expectations remain unchanged from May 2024 outlook
- Inventory levels, U.S CPI, and FOMC projections in focus tomorrow
Crude Oil Analysis
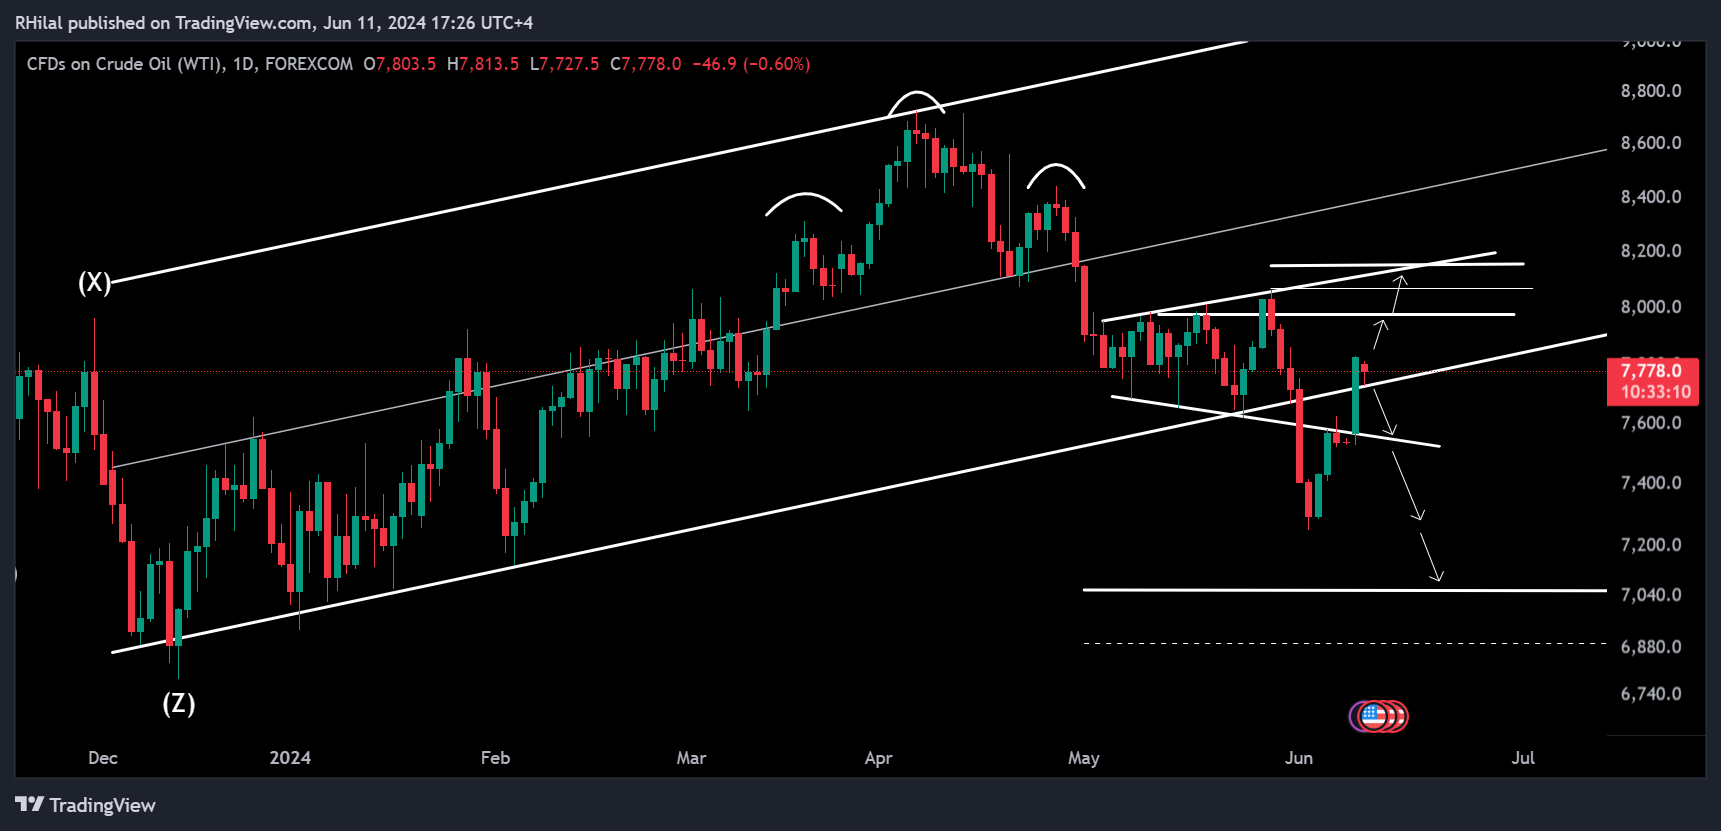
After the Relative Strength Index (RSI) of Crude Oil retested its March 2023 lows, oil price rebounded from the $72.50 low back above its yearly trending support, towards a $78.30 high.
What’s Next?
The market has already priced in the increase in oil supplies concerning the expected demand potential and OPEC quota compliance. The next focus will be on the developing growth outlooks, particularly from the U.S and China. The OPEC monthly report did not introduce any new data regarding changes in supply and demand from the May outlook. The market now awaits the IEA short-term energy outlook for fresh insights into the oil market, particularly beyond the anticipated increase in supply levels. However, the FOMC projections are expected to be the main event driving this week’s market trends, as investors look for clarity on monetary policy and potential rate cuts.
What does that mean for Oil?
The Fed’s outlook is crucial for oil prices. The market is ready to price in contractionary or expansionary views with respect to the economy. Higher rates for longer would not favor oil potential as much as a potential rate cut in the near horizon would.
Natural Gas Analysis
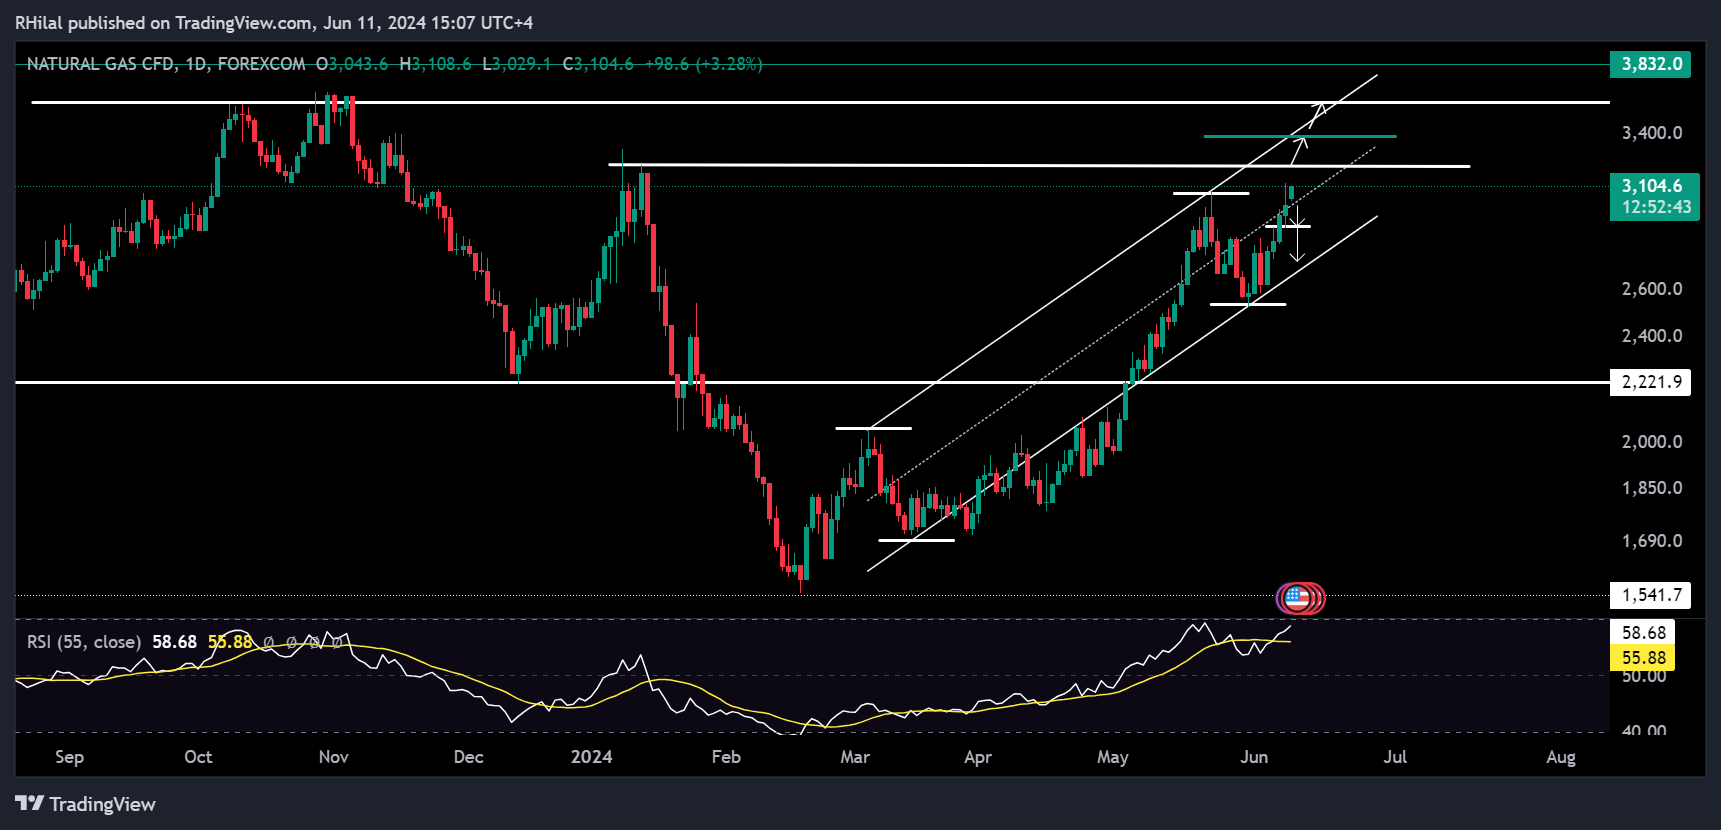
The latest Natural Gas storage report exceeded expectations with an addition of 98 bcf, yet natural gas prices continued their 6-month uptrend. Strong demand levels are expected amid increasing temperature expectations for the month of June, pushing prices back above the key $3 level.
Crude Oil Analysis: USOIL – Daily Time Frame - Logarithmic Scale

Rising back into the yearly up trending channel, and previous broadening pattern, crude oil is correcting from the 78.30 high. This high aligns with the 0.382 retracement between the April high and June low. If prices break higher, the track is set to proceed towards levels 79.80, 80.60, and 81.50 respectively.
On the downside, breaking back below 75, the next support levels to watch are the June low at 72.50 and level 70.70 respectively.
Natural Gas Analysis: Daily Time Frame – Logarithmic Scale

The daily price action for natural gas is strongly bullish, yet the smoothed RSI flags an oversold state. The next projected levels for natural gas are near 3.219 and 3.580, which correspond to this year’s high and November 2023’s high respectively. Potential support levels are between the 2.890 and 2.840 zone in the near term, and 2.700 from a more extreme perspective.
Decreasing inflation levels combined with an improving growth outlook would support the upward trends of crude oil and natural gas. Conversely, sticky inflationary pressures and uncertain economic forecasts could reverse the trends for the next quarter of 2024.
--- Written by Razan Hilal, CMT


