Article Outline
- Key Events: US Sanctions, Earning, and AI
- Technical Analysis: Crude Oil, Nasdaq (3-Day Time Frame)
- Technical Analysis (TA) Tip: Candlestick Psychology
Oil Trends Between Sanctions and Overproduction Risks
Oil’s 2025 uptrend reflects unsustainable bullish momentum, primarily fueled by transient factors: winter demand, a short-term Chinese export boost ahead of U.S. tariff risks and hedging against upside risks driven by U.S. sanctions on Russian oil.
The bullish drive was rejected at the $80 resistance level as concerns over non-OPEC production risks resurfaced following Trump’s inauguration speech, which emphasized oil overproduction. Unlike temporary winter demand, Trump’s policies are set to last four years, introducing lasting influences on the oil market by balancing sanction and production risks. The dominant direction will likely emerge based on key price level breakouts outlined in the technical analysis below.
Netflix Beats Earnings, Open AI to Expand Infrastructure
Netflix reported better-than-expected earnings on Tuesday, boosting market sentiment. Meanwhile, Open AI announced a $500 billion partnership to expand critical U.S. infrastructure, with key collaborators including NVIDIA, Microsoft, and Oracle. Beyond trade war and tariff risks, the tech sector’s ability to push beyond market challenges continues to position it as an emerging haven investment.
Technical Analysis: Quantifying Uncertainties
Crude Oil Analysis: 3 Day Time Frame – Log Scale

Source: Tradingview
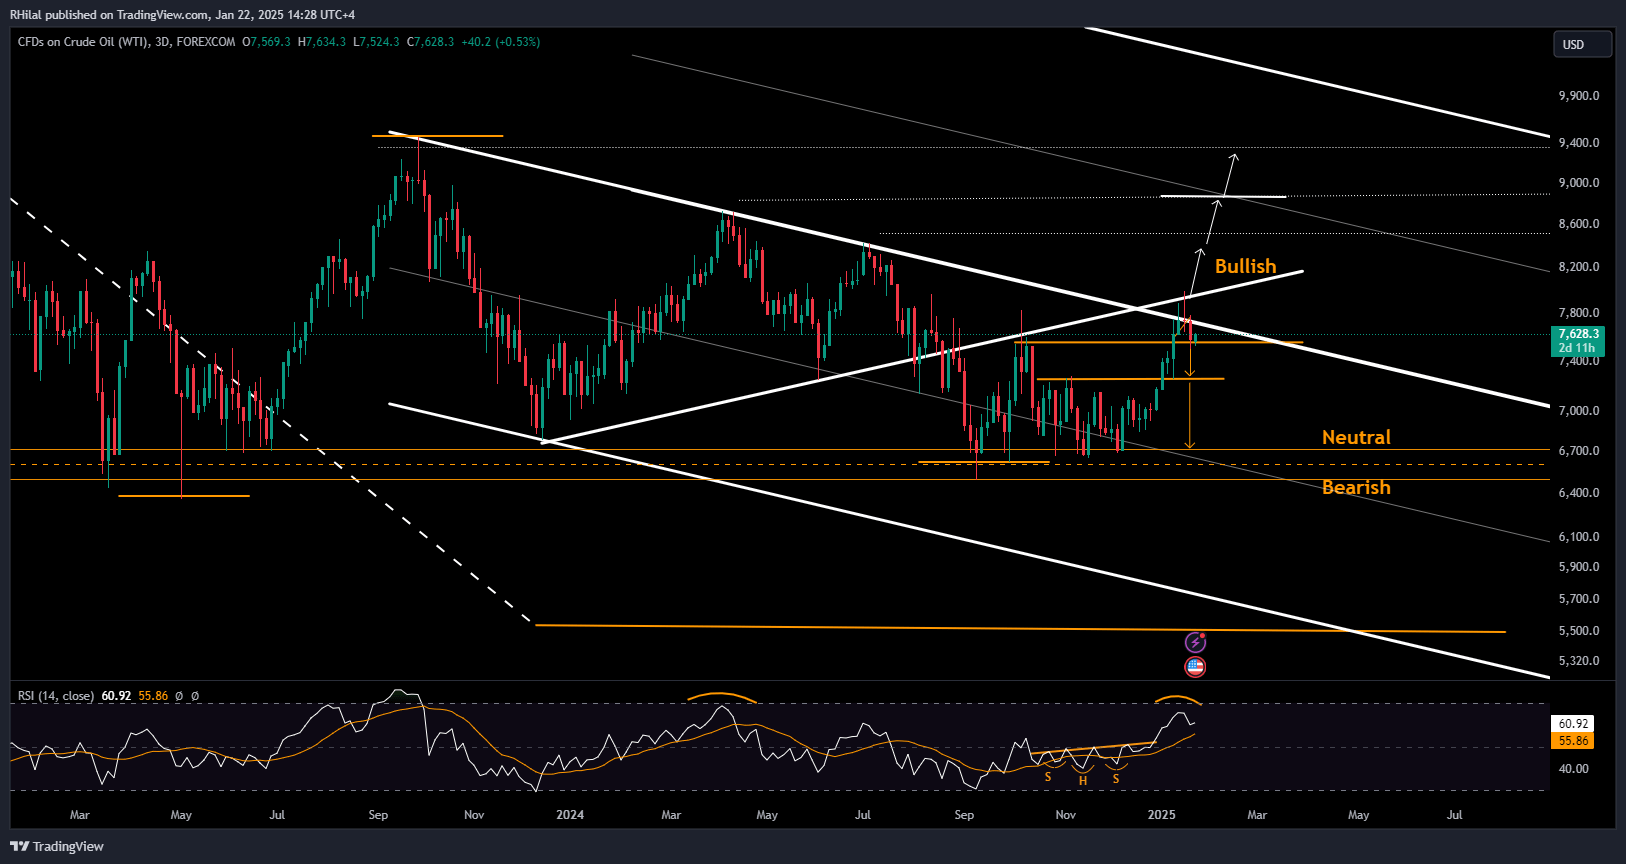
Retesting the lower boundary of the year-long consolidation at $80, oil fell back within the confines of its declining parallel channel, holding at support levels between $75.20 and $76, which align with the October 2024 highs. Reentering the bearish pattern boundaries signals potential further declines in 2025.
A firm close below the $75 level could pave the way for drops toward the next support levels at $72 and $68, before confirming a steeper bearish continuation trend. On the upside, with sanction risks persisting, a close above $80 could reignite bullish momentum, driving prices back toward resistance levels at $84 and $89.
Nasdaq Analysis: 3 Day Time Frame – Log Scale

Source: Tradingview
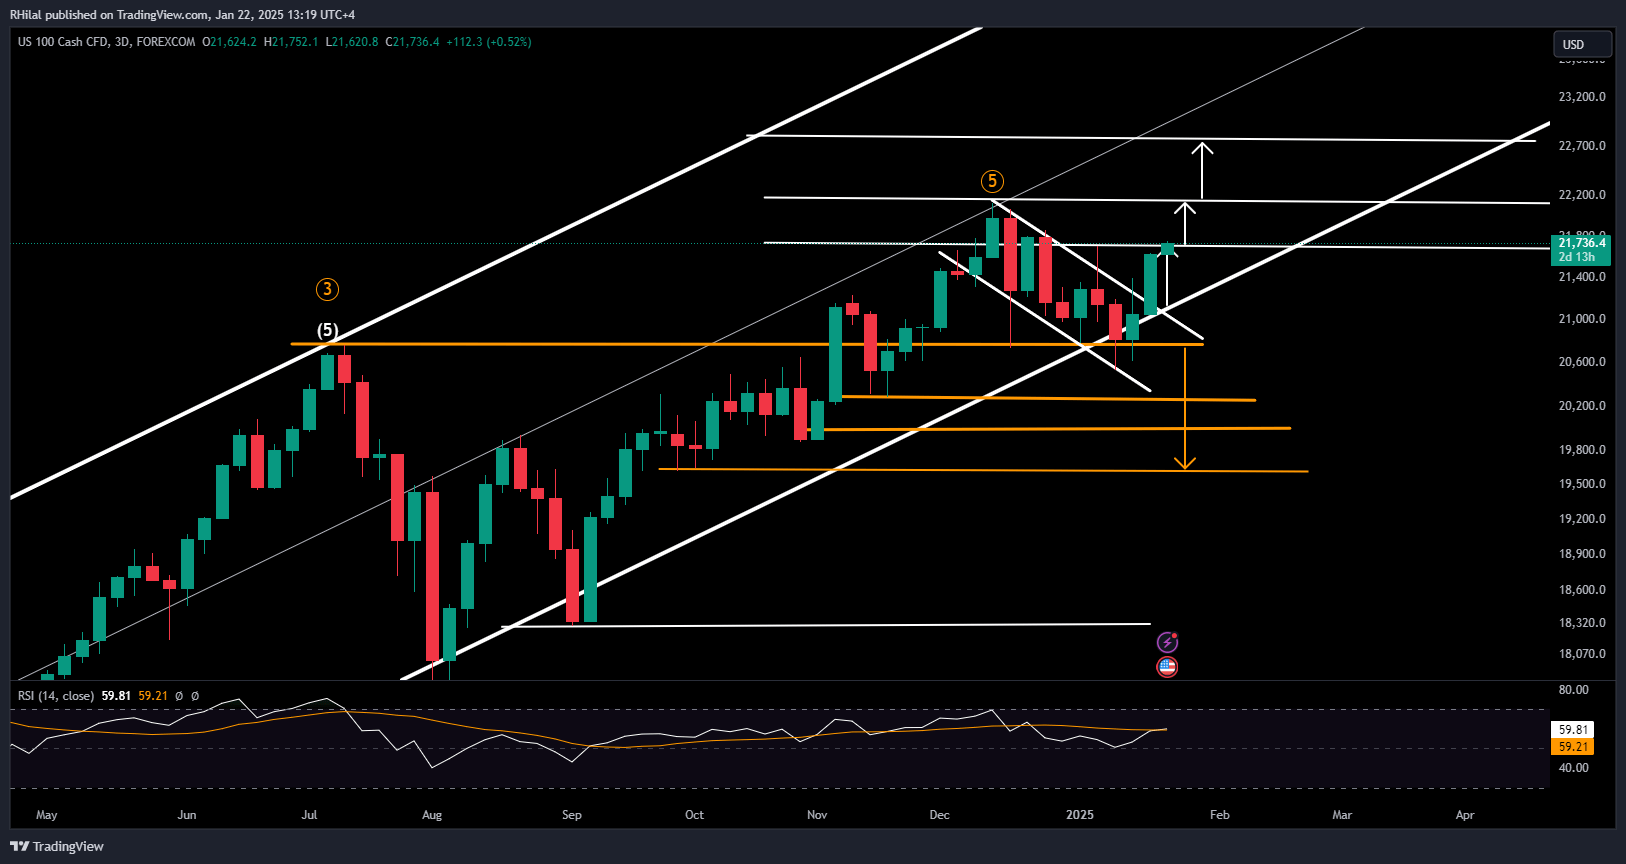
The Nasdaq extended its gains after Netflix’s positive earnings and market excitement surrounding Open AI’s partnership, retesting the critical 21,700 level.
Upside Potential: Holding above 21,700 could push the index back toward its all-time high at 22,133, with new highs expected to find resistance at 22,800.
Downside Risks: Key support levels at 21,400 and 21,100 align with the lower boundary of the primary uptrending channel. A break below these levels could trigger steeper bearish corrections toward 20,700.
Technical Analysis Tip: Candlestick Psychology
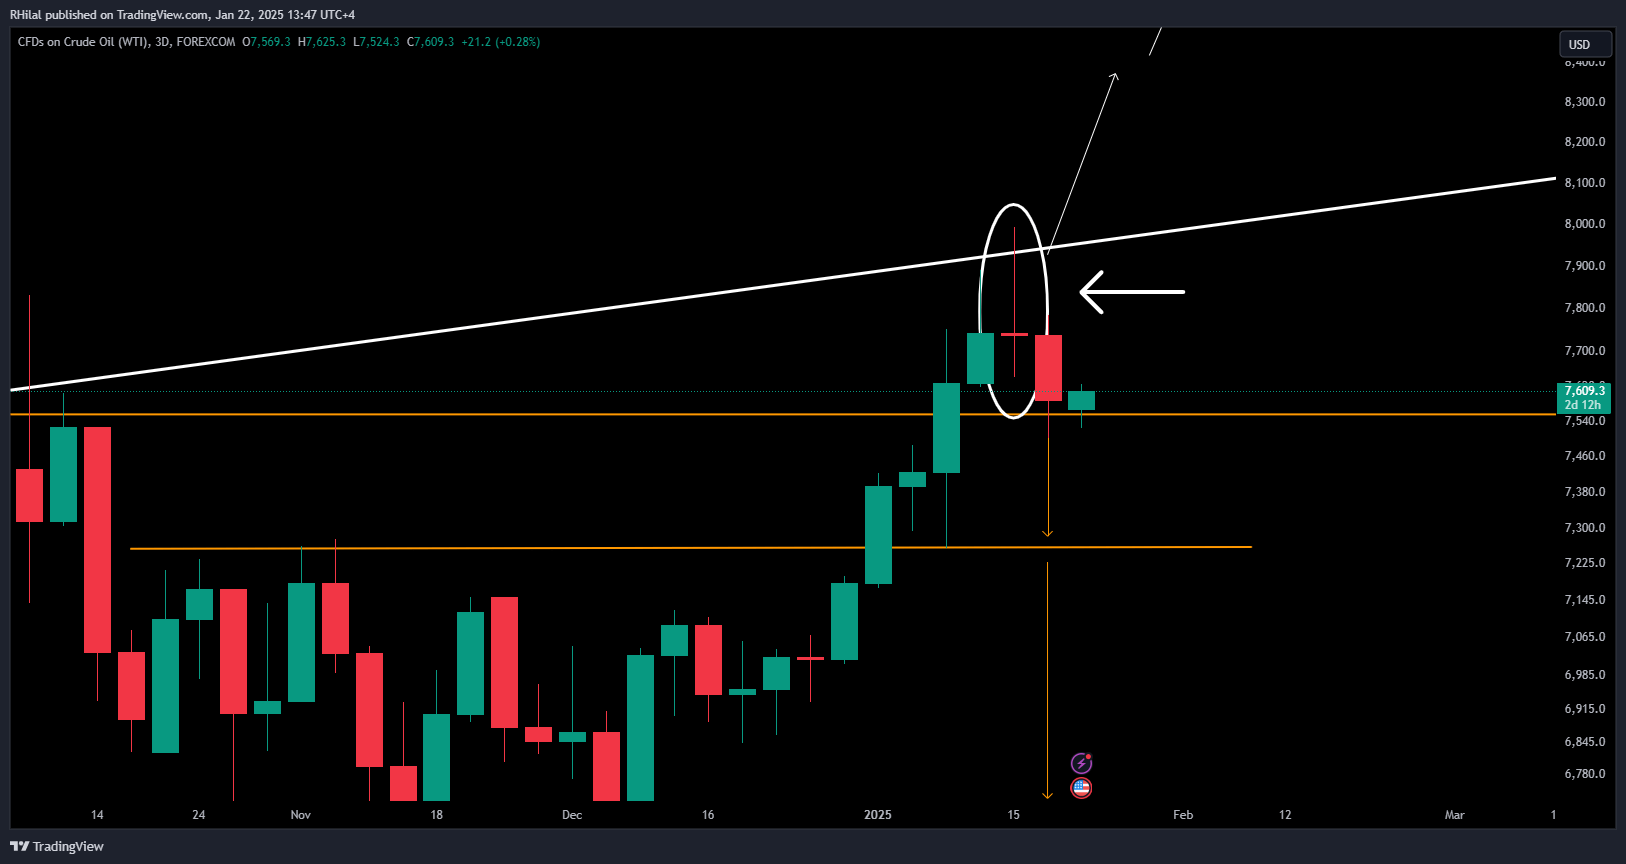
Candlestick patterns provide valuable insights into market sentiment, helping identify continuation and reversal trends. A notable pattern is the gravestone doji, which is particularly relevant to oil’s recent price action.

Source: Tradingview
On the 3-day crude oil chart, a candlestick with specific shadow and body characteristics can be analyzed as follows:
1. Extended Upper Shadow: Indicates an inability to sustain highs, closing near the lower end of the spectrum, reinforcing bearish reversal bias.
2. Indecisive Body: The open and close prices align closely, reflecting neutral-to-bearish sentiment. This pattern supports concerns over oil overproduction and highlights slight indecision regarding bullish hedges against sanctions and geopolitical conflicts.
Written by Razan Hilal CMT
Follow on X: @Rh_waves
On You Tube: Commodities and Forex Trading with Razan Hilal


