Following its euphoric peak at $900B in January 2018, the value of all cryptoassets entered a deep winter, eventually contracting by nearly 90% to just $100B by the end of that year. While it took a while for traders to lick their wounds and jump back in, we’ve finally seen Bitcoin and the broader crypto market exceed the peak from three years ago and eclipse the widely-watched $1 trillion market cap level.
With Bitcoin now trading at more than double its previous price peak and Ethereum, the #2 cryptoasset, hitting a record high of its own as we go to press, traders are wondering how to take advantage of this exciting new asset class. Below, we run down the current technical and fundamental factors for the two biggest cryptoassets:
Bitcoin
With major economies across the globe engaging in unprecedented experiments in monetary and fiscal policy (“money printing” and “deficit spending” colloquially), Bitcoin’s programmatically fixed supply is more attractive than ever. Last year’s quadrennial “Bitcoin halving” cut the new supply of Bitcoin’s to just 6.25 BTC per ten minutes, taking the “inflation rate” of Bitcoin to just 1.8%, below that of gold and most major currencies.
Since the last peak more than three years ago, programmers have dramatically improved Bitcoin’s functionality, building out improvements including the layer-2 Lightning Network for small transactions and enhancements to privacy and fungibility. At the same time, the asset is now more accessible to retail investors than ever, with options to buy from Square’s Cash app, Robinhood, and PayPal, among other big-name services.
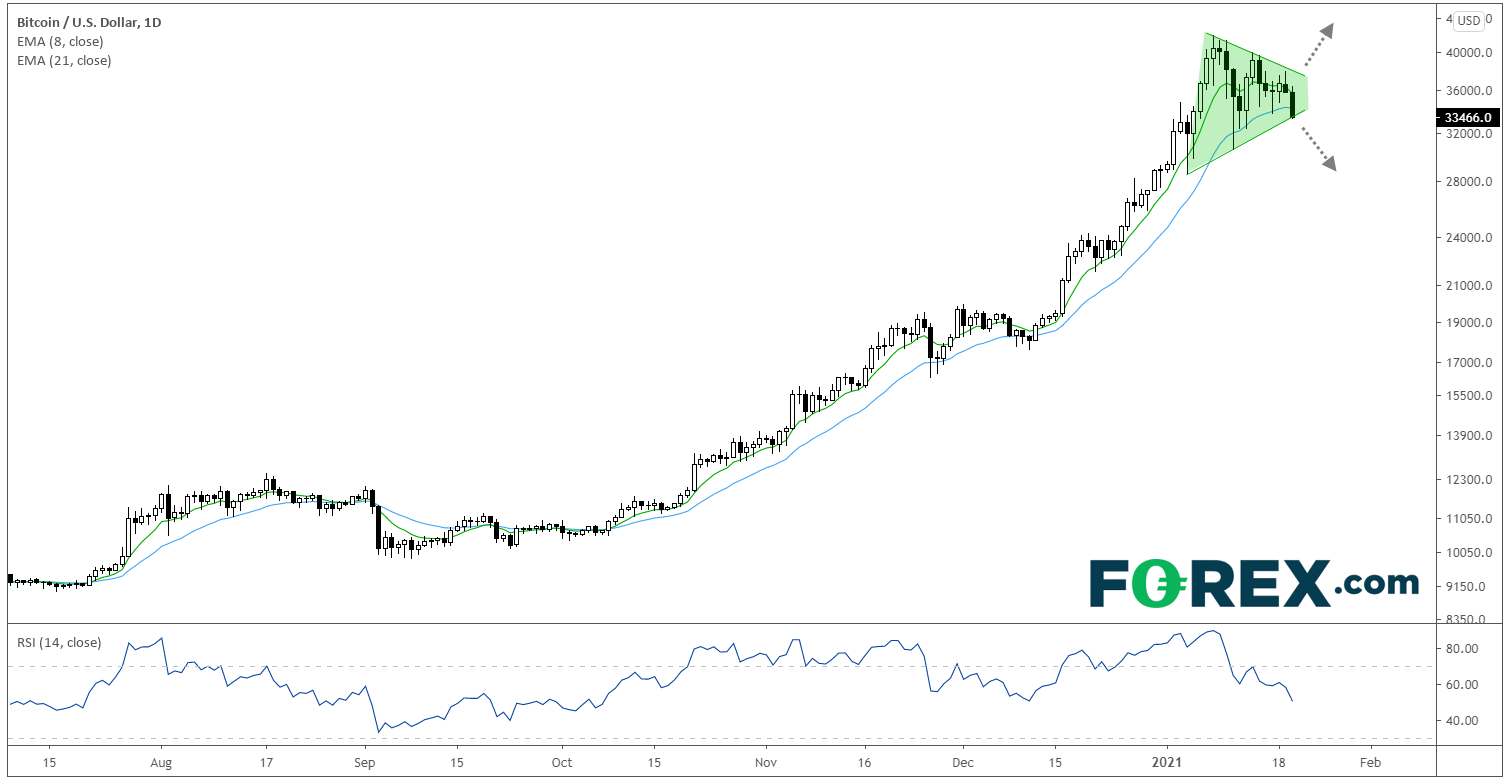
In terms of the bitcoin price, the momentum remains firmly at the bulls’ backs. The cryptoasset has nearly quadrupled in the last four months, highlighting the inherent volatility of the asset class, but the price action so far suggests rates may have further to run. As the chart below shows, the recent consolidation has alleviated the overbought condition in the daily RSI indicator, potentially clearing the way for another leg higher.
From a price action perspective, Bitcoin is currently consolidating within a “bullish pennant” formation, suggesting that prices could exceed $50,000 in short order if we see a bullish breakout in the coming days. One the other hand, a break lower from this pattern would point to a deeper retracement to sub-$30k levels, though it would likely take a more severe drop to erase the established uptrend:

Source: TradingView, GAIN Capital
Ethereum
The world’s second-largest cryptoasset, Ethereum, has come a long way from three years ago, when it was most famous for providing the infrastructure that fueled the Initial Coin Offering (ICO) boom. At a high level, the Ethereum blockchain allows developers to use smart contracts to create decentralized apps (dApps). It underwent a major upgrade to Ethereum 2.0 last year, making the network faster and more secure. At the moment, the dominant narrative driving Ethereum is the growth of Decentralized Finance (DeFi) applications, which facilitate peer-to-peer financial transactions without intermediaries like banks.
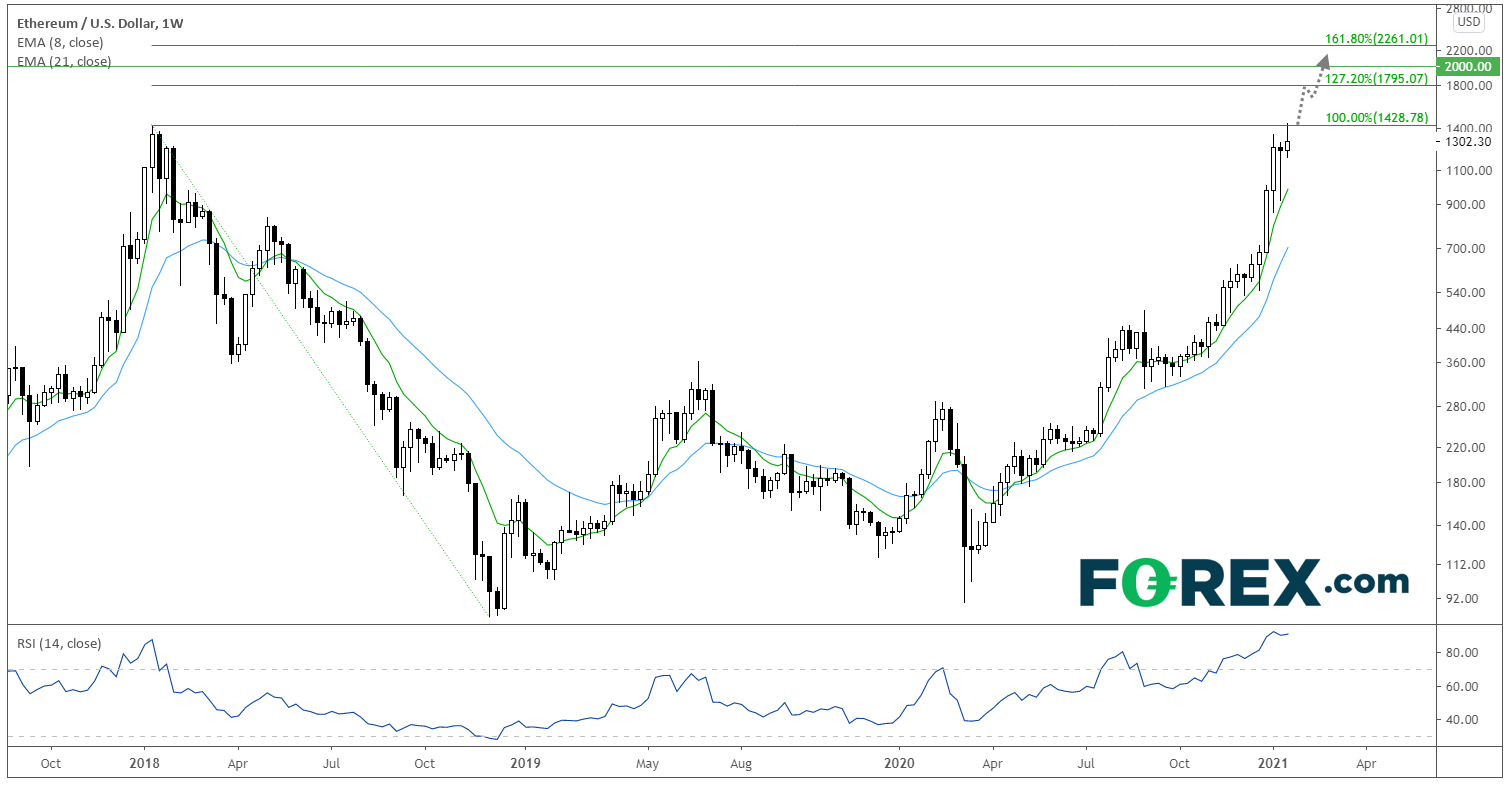
Technically speaking, the Ethereum price has materially outperformed Bitcoin over the last year, with ETH/USD rising from below $100 in the depths of the COVID-19 pandemic bottom in Q1 last year to test a record high near $1300 as of writing. Looking ahead, it’s hard to bet against the strong bullish momentum in Ethereum.
If ETH/USD can confirm its break above the January 2018 high near $1400, bulls may quickly turn their eyes upward toward $1800 (the 127.2% Fibonacci extension of the 2018 collapse), $2000 (key psychological level) or even $2250 (the 161.8% Fibonacci extension). Of course, this relatively new asset class remains tremendously volatile, so prices could easily see a sharp selloff back into the triple digits if they’re unable to clear resistance near $1400, though once again, institutional and retail traders may be eager to buy any short-term dips in the cryptoasset market:

Source: TradingView, GAIN Capital


