It has certainly felt like a one-way bet for gold bulls recently. But with short bets rising an early signs of a pullback on gold prices, perhaps the trend needs a break.
Last week I noted that gold was so close to 2700 it would be rude not to test it. I also suspected it could be a ‘last hurrah’ that could trigger at least a near-term shakeout, so I am pleased to see that has played out nicely. Gold futures popped their ahead above $2700 on Thursday and has now trade lower for two consecutive days, despite a softer-than-expected core PCE print in between.
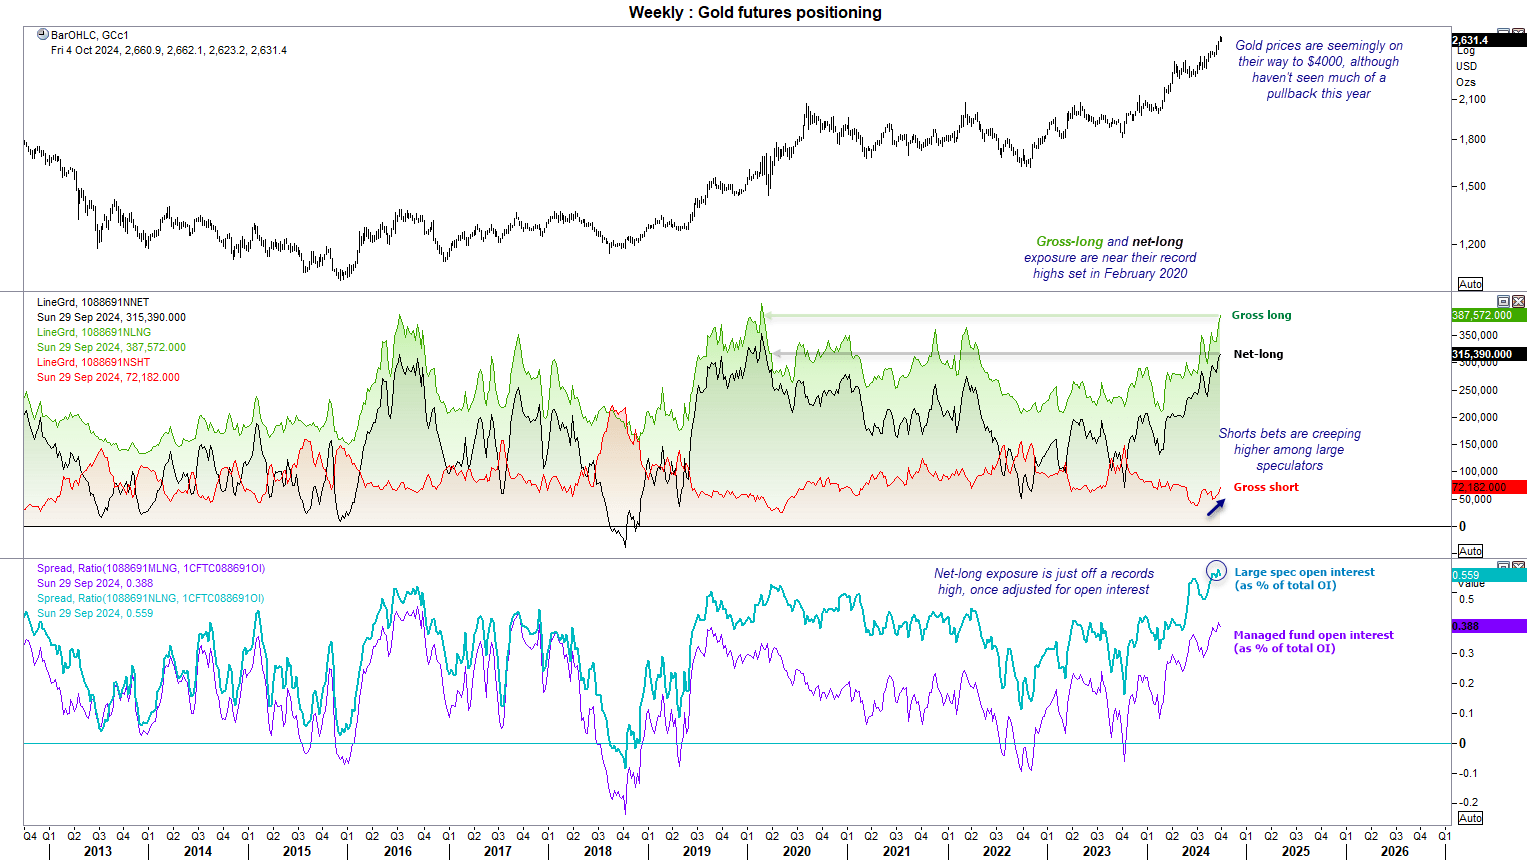
But what really caught my eye in this week’s COT report is that short bets against gold futures are rising among managed funds and large speculators. Admittedly not by a massive amount, but given the extended run we have seen without a decent pullback, perhaps some traders are concerned being long gold is a crowded trade over the near term.
Gold market positioning from the weekly COT report
Gold rising to $3000 is no impossibility when you stand back to admire the longer-term view. But with net-long and gross-long exposure near their record highs among large speculators while short bets creep higher, there may be some nervousness in the air alongside some temptation to book profits before another leg higher.

- Gross-long exposure rose to its highest level since the pandemic (February 2020)
- Gross longs are just 20k contracts below that record high
- Net-long exposure is also hinting at a sentiment extreme and is near its record high set in Feb 2020
- If converted to a % of total open interest (volume), large speculators are near their record level of net-long exposure at 56%
- Managed funds are net-long gold futures at 39% of total open interest
- Gross shorts increased at their fastest pace in 30 weeks among managed funds, and fastest in 10 weeks among large speculators
Gold futures technical analysis (daily chart):
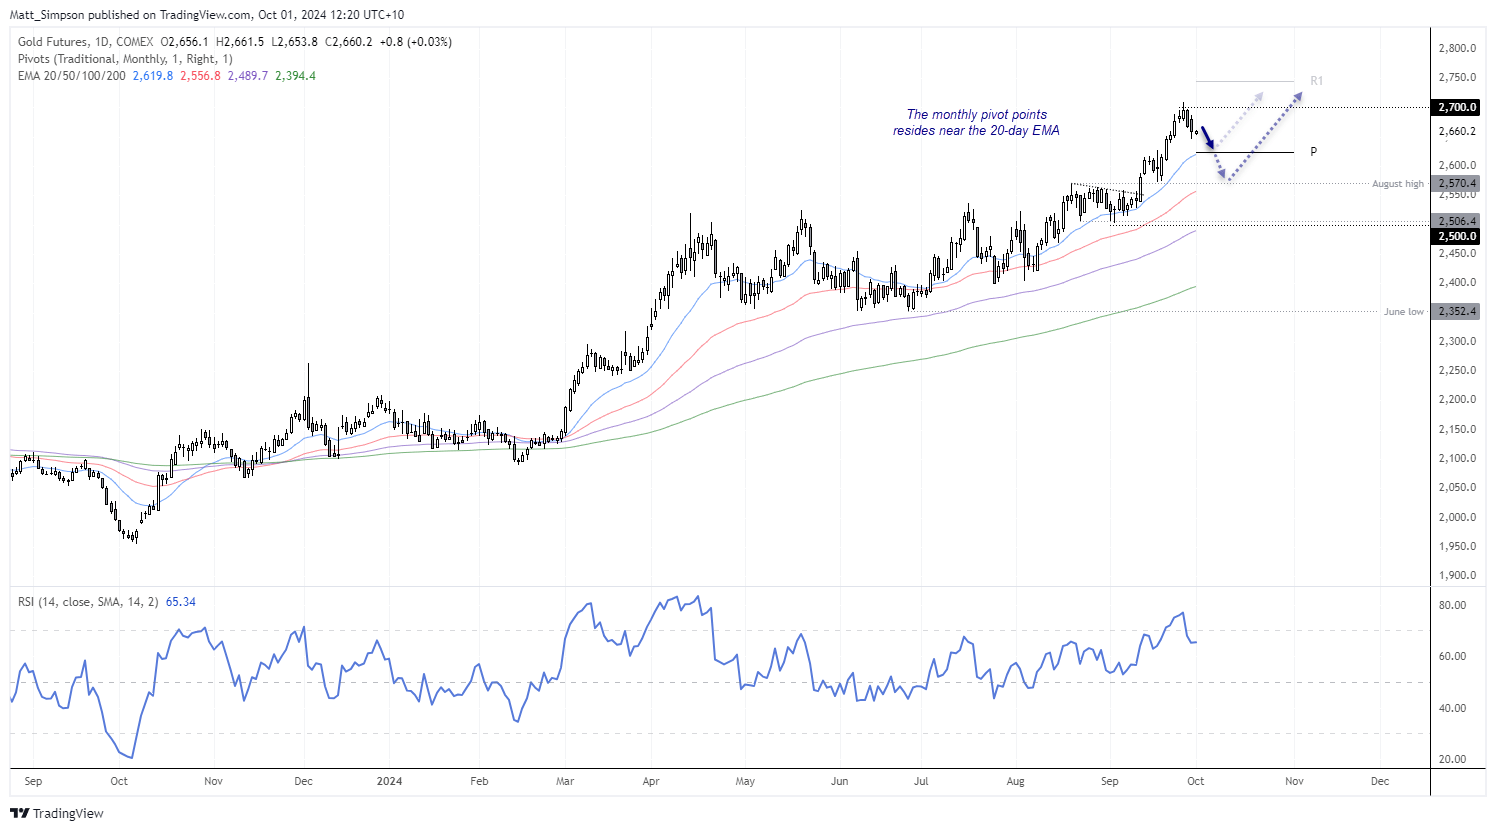
The bullish trend continues to impress and the moving average are fanning out to show strong bullish momentum overall. Yet prices remain extended beyond the 20-day EMA despite a 2-day pullback. Notice that the monthly pivot point $2623) resides near the 20-day EMA (2619), and could be just a day or two’s trade away from retesting it should the current trajectory remain in place.
If incoming US data surprises to the upside then perhaps we’ll see a deeper pullback, although for now I suspect 2600 or even the August high will provide support.

Gold technical analysis (1-hour chart):
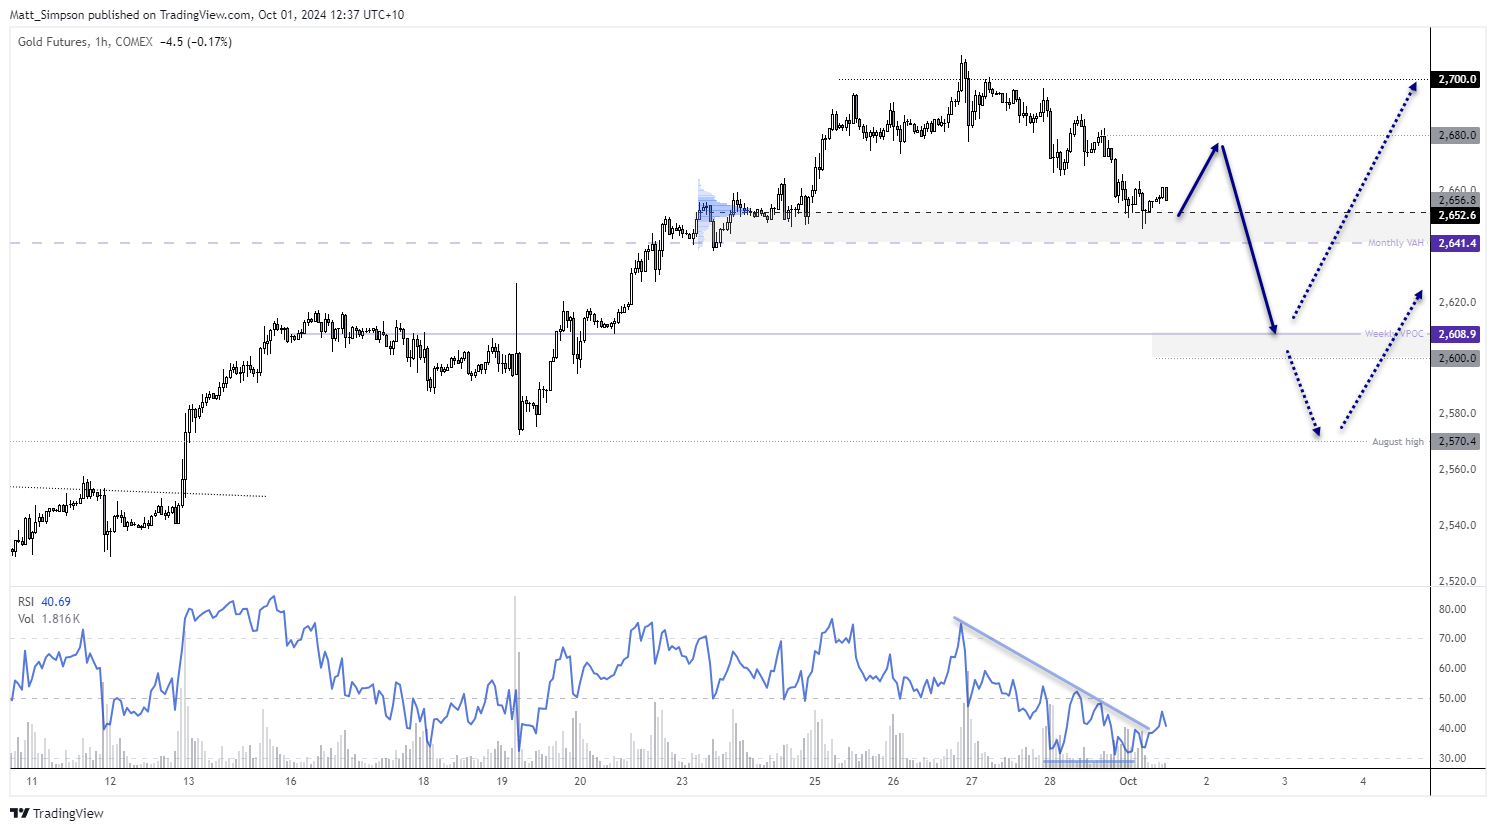
While I see the potential for further losses on the daily chart, support may have been found on the 1 hour. Monday’s low recovered back above a high-volume-node (HVN) from a prior consolidation area and held above the September value area high (VAH). A slight bullish divergence has also formed on the RSI 14.
Intraday bulls could seek dips towards Monday’s low for a cheeky swing trade long, or bears could seek to fade into minor rallies should a reversal pattern form below 2680.

-- Written by Matt Simpson
Follow Matt on Twitter @cLeverEdge


