Australian Technical Forecast: AUD/USD Weekly Trade Levels
- Australian Dollar breakout extends nearly 5% off September low to fresh yearly highs
- AUD/USD August rally vulnerable into Q4 open / below technical resistance- NFPs on tap
- Resistance 6900/16 (key), 7001, 7109/37- Support 6810/19, 6716 (key), 6670
The Australian Dollar is at risk of snapping a three-week rally with AUD/USD struggling at fresh yearly highs after rallying nearly 9.4% off the August lows. A breakout of the 2023 consolidation pattern takes Aussie into technical resistance the focus is on a possible price inflection off this zone into the start of the month / quarter. These are the levels that matter on the AUD/USD weekly technical chart.
Review my latest Weekly Strategy Webinar for an in-depth breakdown of this Aussie setup and more. Join live on Monday’s at 8:30am EST.Australian Dollar Price Chart – AUD/USD Weekly

Chart Prepared by Michael Boutros, Sr. Technical Strategist; AUD/USD on TradingView
Technical Outlook: In my last Australian Dollar Technical Forecast we noted that, “the immediate focus on a breakout of the 6642-6819 range. From at trading standpoint, losses should be limited to the 52-week moving average IF Aussie is heading for a breakout here.” A topside breach two-weeks later fueled a rally of more than 4.8% off the September lows with AUD/USD extending into confluent technical resistance last week at 6900/16- a region defined by the June / July 2023 swing highs and the 61.8% extension of the August rally. Note that the median-line of a newly identified ascending pitchfork rests just higher and the immediate advance may be vulnerable while below this slope.
Initial weekly support rests back with the 2024 yearly open / 61.8% retracement of the 2023 range at 6810/19 and is backed by the 38.2% retracement of the yearly range at 6716- losses should be limited to this threshold IF price is heading higher on this stretch (medium-term bullish invalidation). Subsequent support seen at the 2019 low at 6670 and the yearly low-week close (LWC) / 61.8% retracement at 6572/75 in the event of a break.
A topside breach / close above the median-line is needed to mark uptrend resumption with such a scenario exposing subsequent resistance objectives at the 2021 LWC at 7001 and 7109/37- a region defined by the 2023 high-close (HC) and the August 2022 swing high. Look for a larger reaction there IF reached with a close above need to keep the focus on 7300.
Bottom line: The Aussie breakout is now testing the first major hurdle at confluent resistance- the immediate advance may be vulnerable while below this threshold. From a trading standpoint, losses should be limited to 6810 IF price is heading higher on this stretch with a close above 6916 needed to fuel the next major move.
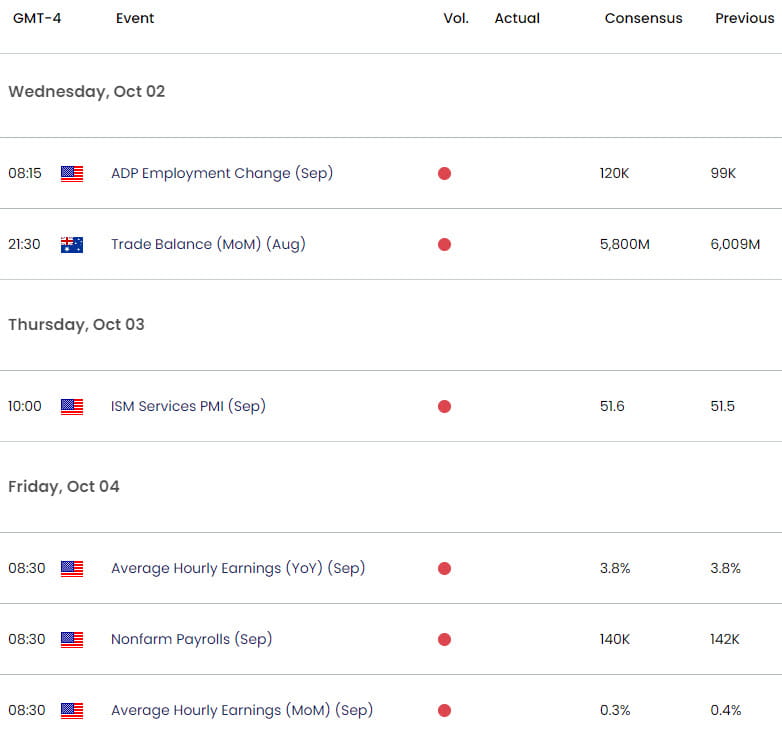
Keep in mind we are just carving the monthly / quarterly opening-ranges with US Non-Farm Payrolls on tap Friday. Stay nimble into the release and watch the weekly close here for guidance. Review my latest Australian Dollar Short-term Outlook for a closer look at the near-term AUD/USD technical trade levels.
Australia / US Economic Calendar

Economic Calendar - latest economic developments and upcoming event risk.
Active Weekly Technical Charts
--- Written by Michael Boutros, Sr Technical Strategist with FOREX.com
Follow Michael on X @MBForex


