Australian Dollar Technical Outlook: AUD/USD Short-term Trade Levels
- AUD/USD September rally halted major technical resistance- weekly opening-range intact
- Australian Dollar plunges nearly 1.3% off yearly high- now testing major support pivot
- Resistance 6871/99 (key), ~6950s, 6991-7017– Support 6807/19, 6759/61, 6694 (key)
The Australian Dollar has rallied for nine-of-the-past-eleven days with AUD/USD poised to mark a bearish engulfing candle today off technical uptrend resistance. The decline takes Aussie into a major pivot zone and the battle lines are drawn heading into the close of the month. These are the updated targets an invalidation levels that matter on the AUD/USD short-term technical charts.
Review my latest Weekly Strategy Webinar for an in-depth breakdown of this AUD/USD technical setup and more. Join live on Monday’s at 8:30am EST.Australian Dollar Price Chart – AUD/USD Daily

Chart Prepared by Michael Boutros, Sr. Technical Strategist; AUD/USD on TradingView
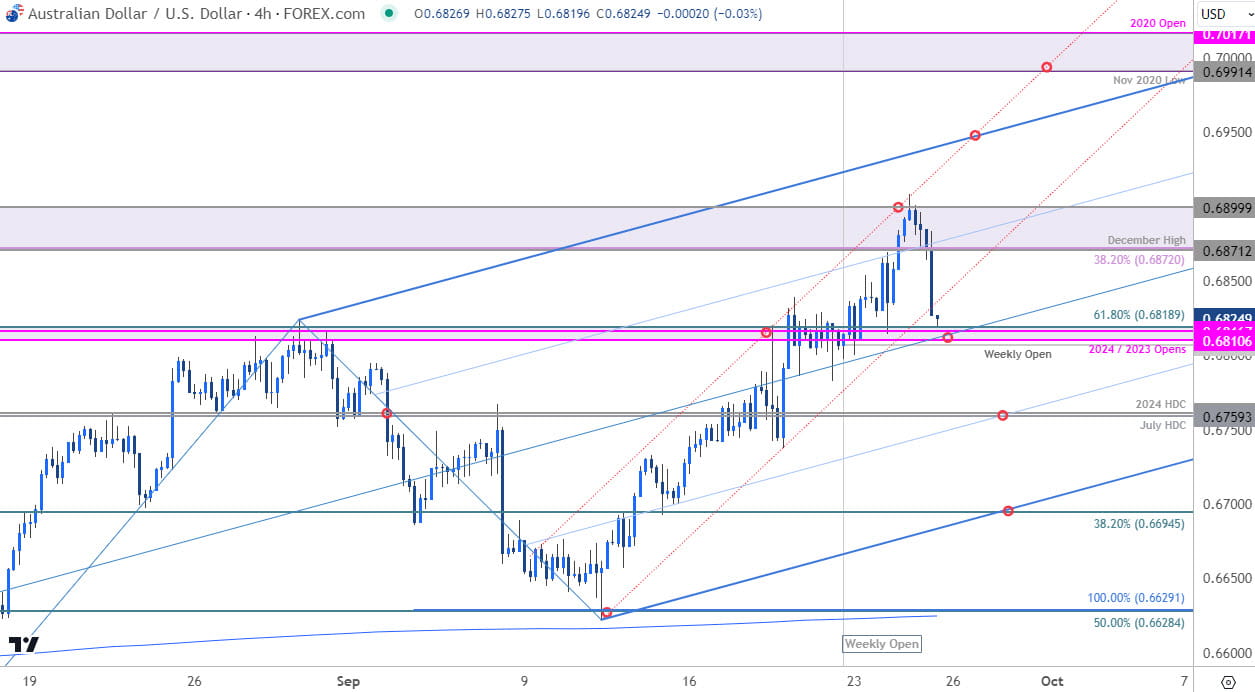
Technical Outlook: In my last Australian Dollar Short-term Outlook we noted that AUD/USD was approaching initial resistance objectives and that, “From a trading standpoint, losses should be limited to the weekly-open IF price is heading higher on this stretch with a close above 6761 needed to mark uptrend resumption.” Aussie broke through resistance a few days later with a rally of more than 4.3% taking price into critical resistance this week at 6871/99- a region defined by the December high, the 38.2% retracement of the 2021 decline, and the 2023 June swing high.
AUD/USD is already down nearly 1.3% off the yearly high with price now attempting to mark a bearish engulfing candle. The immediate focus is on possible inflection into a key pivot zone here at 6807/19- a region defined by the weekly open, the 2023 & 2024 yearly opens, and the 61.8% retracement of the 2023 decline. Looking for guidance off this mark.
Australian Dollar Price Chart – AUD/USD 240min

Chart Prepared by Michael Boutros, Sr. Technical Strategist; AUD/USD on TradingView
Notes: A closer look at Aussie price action shows AUD/USD trading with the confines an ascending pitchfork extending off the August / September lows with the median-line further highlighting near-term support here at 6807/19. A break / close below this threshold would be needed to suggest a more significant high was registered today / invalidate the monthly uptrend with subsequent support objectives seen at the September open / July & 2024 high-day closes (HDC) at 6751/61. Broader bullish invalidation now raised to the 38.2% retracement at 6694.
A topside breach / close above this key pivot zone is needed to mark uptrend resumption with such a scenario likely to fuel another accelerated bout of gains. Initial resistance objectives eyed at the highlighted slope confluence (currently ~6950s) and a more significant technical consideration at 6991-7017- a region defined by the November 2020 low, the 2021 low-week close (LWC), and the 2020 yearly open. Look for a larger reaction there IF reached.
Bottom line: Aussie reversed off major technical resistance today with the pullback now approaching the first major test of uptrend support- risk for downside exhaustion / price inflection into this zone in the days ahead. The immediate focus is on a breakout of the weekly opening-range for guidance. From at trading standpoint- losses would need to be limited to 6694 IF price is heading higher on this stretch with a close above 6900 needed to fuel the next leg in price.
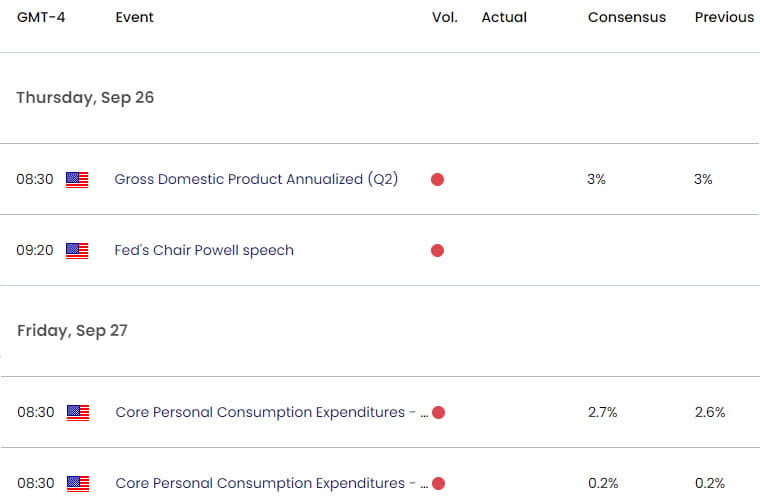
Keep in mind we get the release of the August Core Personal Consumption Expenditure (PCE) on Friday with US Non-farm Payrolls on tap next week. Stay nimble into the monthly cross and watch the weekly closes here for guidance.
Key Economic Data Releases

Economic Calendar - latest economic developments and upcoming event risk.
Active Short-term Technical Charts
Written by Michael Boutros, Sr Technical Strategist
Follow Michael on X @MBForex


