Australian Dollar technical outlook: AUD/USD short-term trade levels
- Australian Dollar plunges into key pivot zone – threatens larger correction
- AUD/USD challenging April opening-range lows- breakout pending
- Resistance 6670/73, 6708, 6740s (key)– support 6640/47, 6584, 6541/47
The Australian Dollar has plunged into a key support pivot with the threat of a larger correction looming while below the 67-handle. These are the updated targets and invalidation levels that matter on the AUD/USD short-term technical chart.
Discussing this Aussie setup and more in the Weekly Strategy Webinars on Monday’s at 8:30am EST.
Australian Dollar Price Chart – AUD/USD Daily

Chart Prepared by Michael Boutros, Sr. Technical Strategist; AUD/USD on TradingView
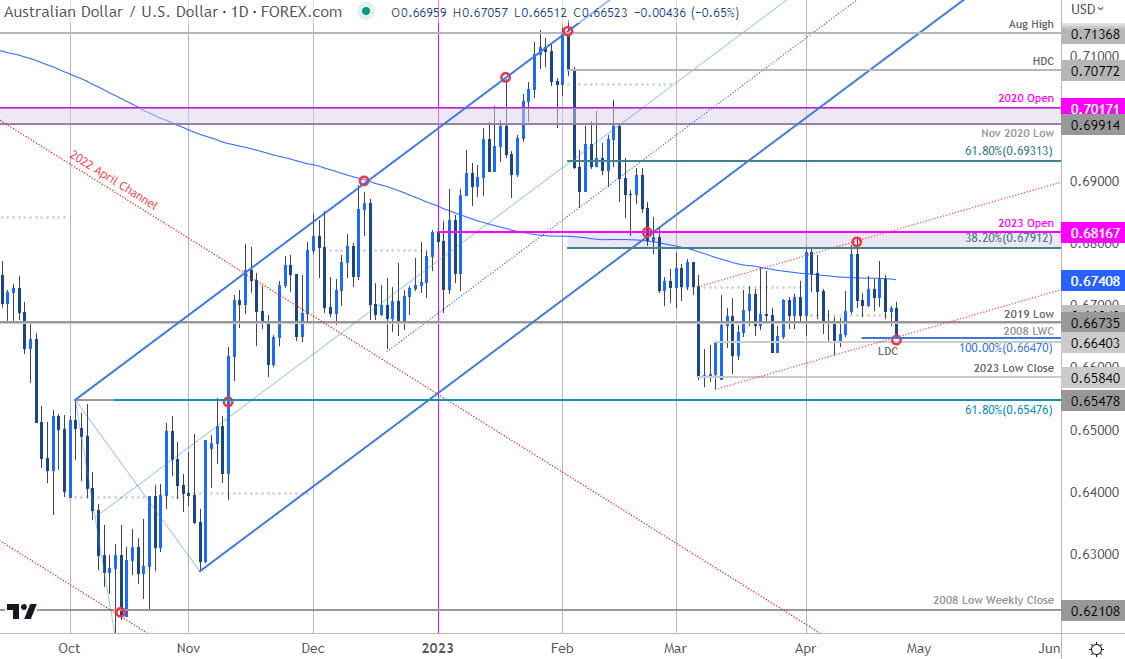
Technical Outlook: In my last Australian Dollar short-term outlook we noted that AUD/USD had responded to critical resistance zone early in the month and that, “rallies should be limited by the 68-handle IF price is heading lower on this stretch.” A second attempted breach on April 14th briefly registered and intraday high at 6805 before reversing sharply with Aussie plunging more than 2.2% off the monthly high.
Price is now approaching confluent support at 6640/47- a region defined by the yearly low-day close and the 100% extension of the decline off the monthly high. Looking for possible price inflection off this zone.
Australian Dollar Price Chart – AUD/USD 240min

Chart Prepared by Michael Boutros, Sr. Technical Strategist; AUD/USD on TradingView
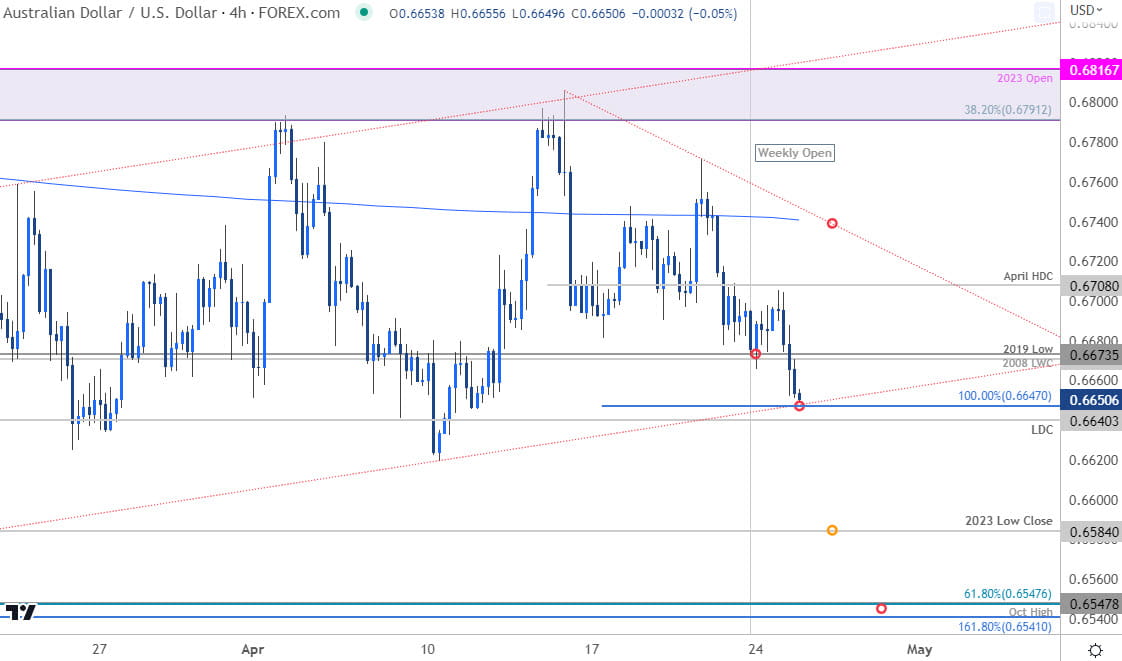
Notes: A closer look at Aussie price action shows AUD/USD approaching confluent support in early US trade today – a break / close below this threshold would threaten a steeper correction towards initial support objectives at the yearly low-close at 6584 and a key technical confluence at 6541/47- a region defined by the 1.618% extension of the broader February decline, the October swing high, and the 61.8% Fibonacci retracement of the October rally. Look for a larger reaction there IF reached.
Initial resistance now eyed back at the 2008 low-week close / 2019 low at 6670/73 and the April high-day close at 6708. Ultimately, a breach / close above the 200-DMA at ~6740s would be needed to mark resumption of the March uptrend.
Bottom line: AUD/USD is testing confluent uptrend support here and we’re looking for possible price inflection off this mark. From a trading standpoint, a good zone to reduce portions of short-exposure / lower protective stops – rallies should be limited to the 6700 IF Aussie is indeed heading lower on this stretch with a break below the objective April opening-range needed to clear the way for a larger decline. Review my latest Australian Dollar weekly technical forecast for a closer look at the longer-term AUD/USD trade levels.
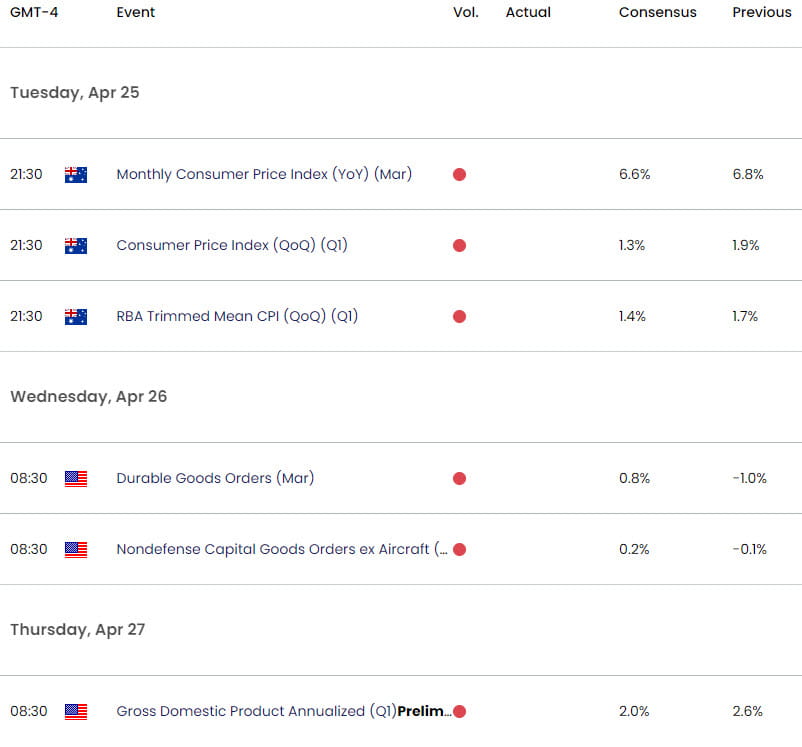
Key Economic Data Releases

Economic Calendar - latest economic developments and upcoming event risk.
Active Short-term Technical Charts
- Japanese Yen short-term outlook: USD/JPY bulls blocked by 135
- Canadian Dollar short-term outlook: USD/CAD bulls emerge at support
- British Pound short-term outlook: GBP/USD threatens correction
- Euro short-term outlook: EUR/USD trend correction on the horizon
- US Dollar short-term outlook: USD collapses to yearly low- DXY levels
- Gold short-term price outlook: XAU/USD bulls run out of breath
--- Written by Michael Boutros, Sr Technical Strategist with FOREX.com


