AUD/USD Outlook
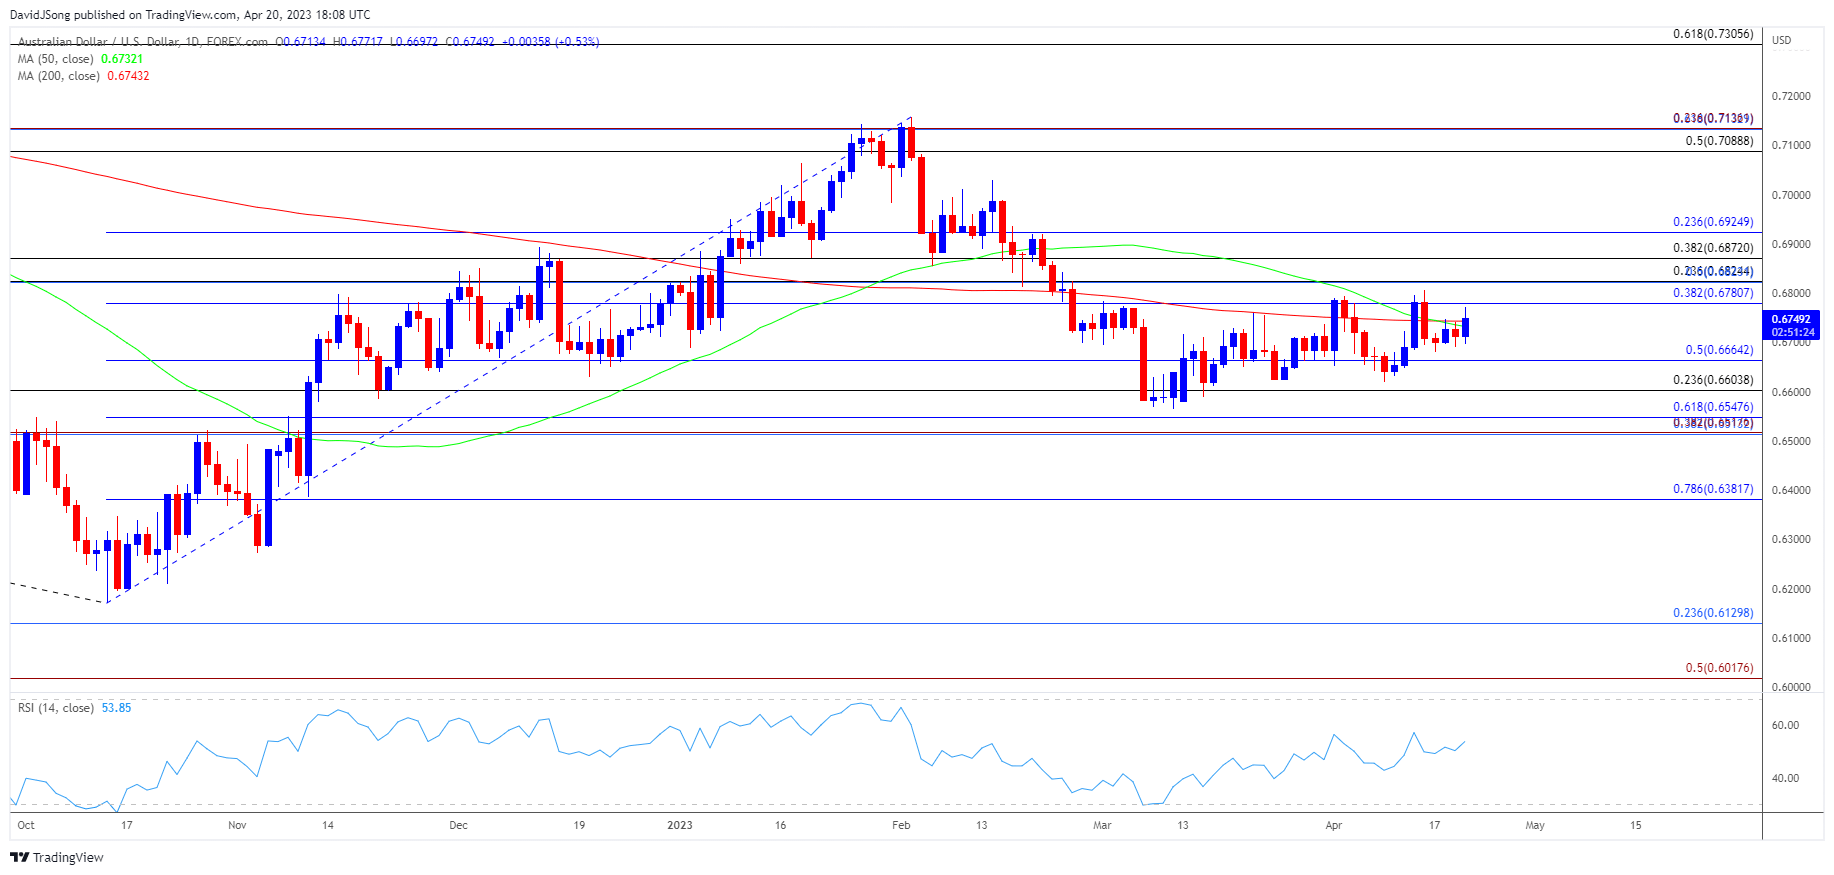
AUD/USD trades back above the 200-Day SMA (0.6743) as it registers a fresh weekly high (0.6770), but failure to test the monthly high (0.6806) may undermine the recent advance in the exchange rate as a ‘death cross’ formation takes shape.
AUD/USD outlook clouded by ‘Death Cross’ formation
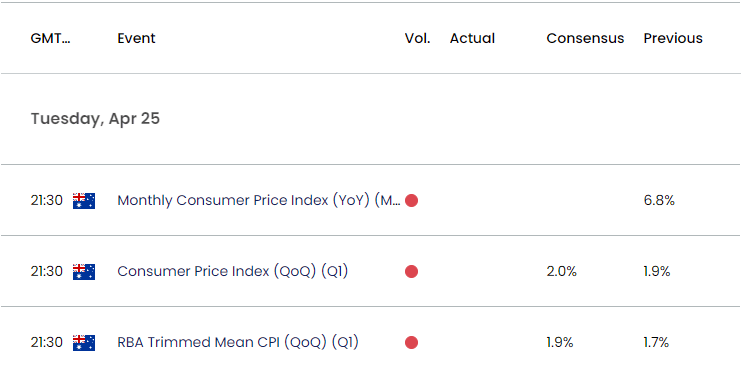
AUD/USD initiates a series of higher highs and lows as it bounces back ahead of the weekly low (0.6681), and the exchange rate may stage a larger rebound ahead of the update to Australia’s Consumer Price Index (CPI) as the report is anticipated to show sticky inflation.
Register here for the next Live Economic Coverage event with David Song

Data prints coming out of Australia may influence the near-term outlook for AUD/USD as both the headline and core CPI are projected to increase in the first quarter of 2023, and signs of persistent price growth may sway the Reserve Bank of Australia (RBA) as the central bank acknowledges that ‘the forecasts produced by the staff in February had inflation returning to the target range only by mid-2025 and that it would be inconsistent with the Board’s mandate for it to tolerate a slower return to target.’
In turn, the RBA may restore its hiking-cycle as Governor Philip Lowe and Co. recognize that ‘it was better to continue to raise interest rates to ensure inflation is brought back to target faster, and the central bank may prepare Australian households and businesses for higher interest rates as the next meeting on May 2 as the minutes from the April meeting emphasize that ‘it was important to be clear that monetary policy may need to be tightened at subsequent meetings.’
Until then, developments coming out of Australia and the US may impact the near-term outlook for AUD/USD amid speculation for another 25bp Federal Reserve rate hike in May, and it remains to be seen if exchange rate will respond to the negative slopes in both the 50-Day SMA (0.6732) and 200-Day SMA (0.6770) amid the recent crossover in the moving averages.
With that said, AUD/USD may attempt to test the monthly high (0.6806) as it initiates a series of higher highs and lows, but failure hold above the moving averages may undermine the recent advance in the exchange rate as a ‘death cross’ formation takes shape.
Australian Dollar Price Chart – AUD/USD Daily

Chart Prepared by David Song, Strategist; AUD/USD on TradingView
- AUD/USD bounces back ahead of the weekly low (0.6681) to register a fresh weekly high (0.6770), and the exchange rate may attempt to test the monthly high (0.6806) as it initiates a fresh series of higher highs and lows.
- A break/close above the 0.6780 (38.2% Fibonacci retracement) to 0.6820 (23.6% Fibonacci retracement) region raises the scope for a move towards 0.6870 (38.2% Fibonacci retracement), but AUD/USD may respond to the negative slopes in both the 50-Day SMA (0.6732) and 200-Day SMA (0.6770) as the recent crossover produces a ‘death cross’ formation.
- Failure to hold above the moving averages may push AUD/USD back towards 0.6660 (50% Fibonacci retracement), with a move below the monthly low (0.6620) bringing the 0.6600 (23.6% Fibonacci retracement) handle back on the radar.
Additional Resources
USD/CAD climbs above 200-Day SMA to approach monthly high
USD/JPY eyes March high as 50-Day SMA establishes positive slope
--- Written by David Song, Strategist


