
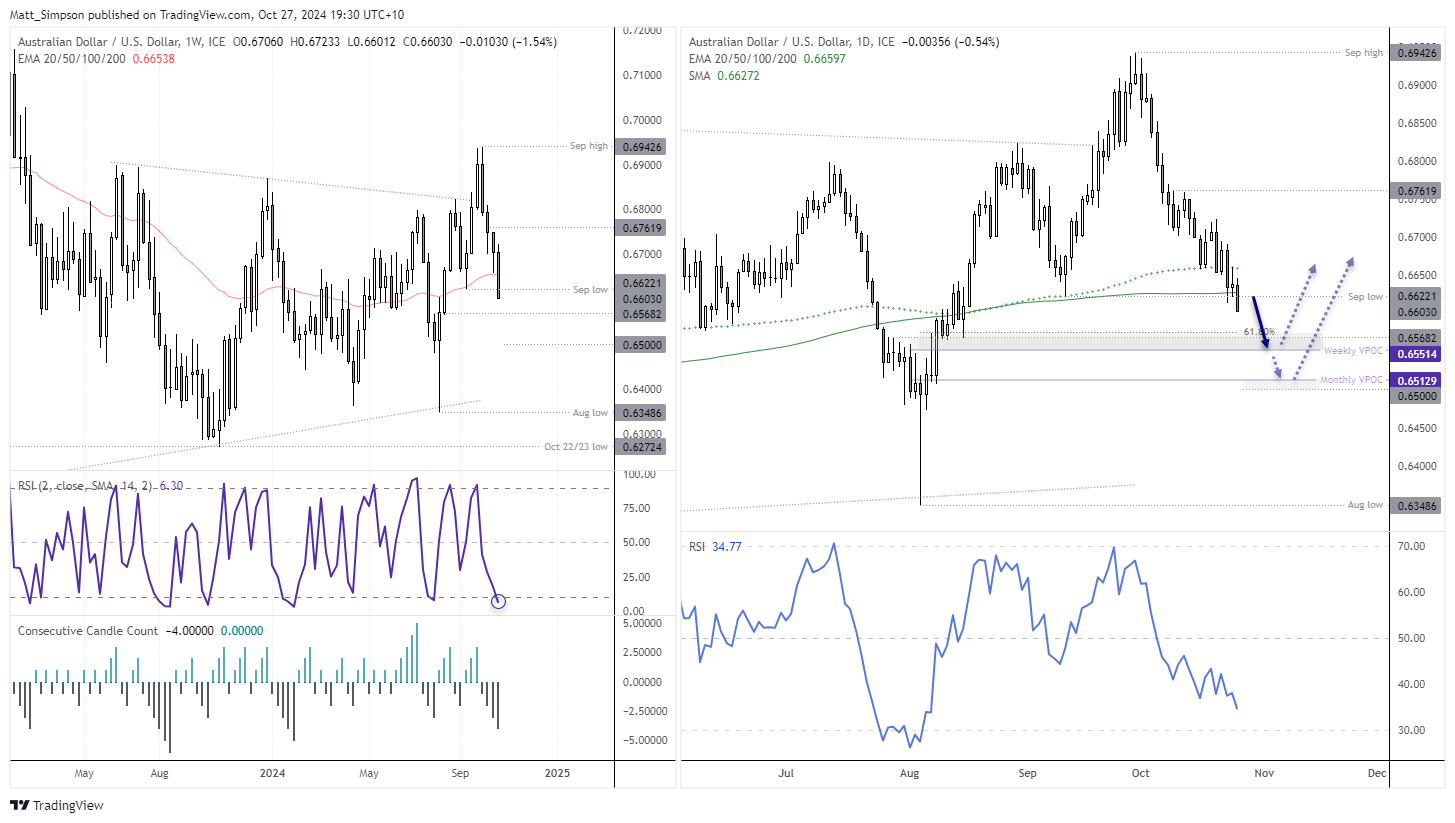
- AUD/USD fell for a fourth week and closed beneath its 200-day SMA on Friday
- Election jitters with Trump rising in the polls and higher US yields appear to be behind the ‘risk-off’ moves for AUD/USD
- Australia’s quarterly CPI is the main domestic event, although I doubt it will soften enough to warrant a dovish RBA
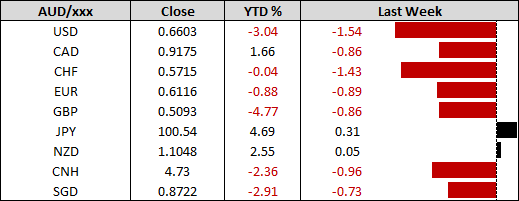
The US election is fast approaching
We can breeze past Monday and Tuesday with little to nothing of great interest in the calendar. Although traders will need to keep an eye on election headlines as it is beginning to make an impact on sentiment, and that means AUD/USD can get caught in the crosswinds. But from Wednesday onwards the economic calendar really heats up.
Australia’s quarterly CPI report
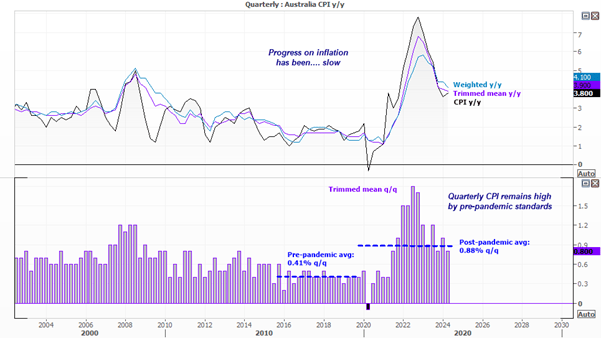
Trimmed mean is the inflation figure to watch, if you had to watch just one. Although I doubt it will do much if a favour for the RBA, where rate cuts are concerned. While its 0.8% q/q print was its second lowest in three years, it was only marginally beneath its 0.88% post-pandemic average. The four years prior to the pandemic averaged 0.41% q/q, and the annual rate of trimmed mean is also a hefty 3.9% y/y. And as the name suggests, trimmed mean has had volatility squeezed out of it, so rarely deviates too far from the prior read. Perhaps the bigger risk here is if we see trimmed mean quarterly rise 0.8% or higher and spark calls for another hike.
Still, traders will react if headline CPI comes in soft, I just doubt it will make a material impact on the RBA who are still mulling over whether a cut or hike is more likely, if or when it happens at all.
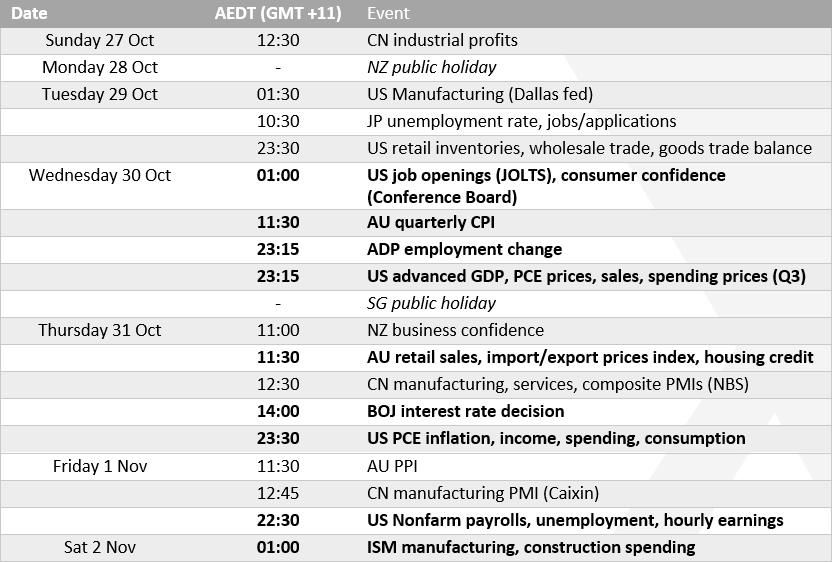
Australian retail sales also warrants a look on Thursday, to see if consumers maintained their spending momentum. August’s figures saw a rise of 0.7% m/m to mark its second strongest increase of the year. The 3.1% y/y rate was its highest since May 2023. This hardly screams “rate cut”.
Two key US reports then cap the week off, with PCE inflation on Thursday and nonfarm payrolls on Friday. If recent data is anything to go by, both could exceed estimates and provide further support for yields. If coupled with Trump increasing his lead on election polls, AUD/USD bulls could be in for another tough week.
AUD/USD correlation table:
- The positive correlation with yield differentials returned last week, with the 3-day rolling correlation between AUD/USD and the AU-US 2-year spread rising to 0.91
- The inverse relationship between the USD index and AUD/USD remains firm on the 2-week (10-day) and 4-week (20-day) timeframes
- A strong relationship between the Chinese yuan is also in play with USD/CNY scoring -0.9 and -0.81 on the 20-day and 60-day timeframes

AUD/USD futures – market positioning from the COT report:
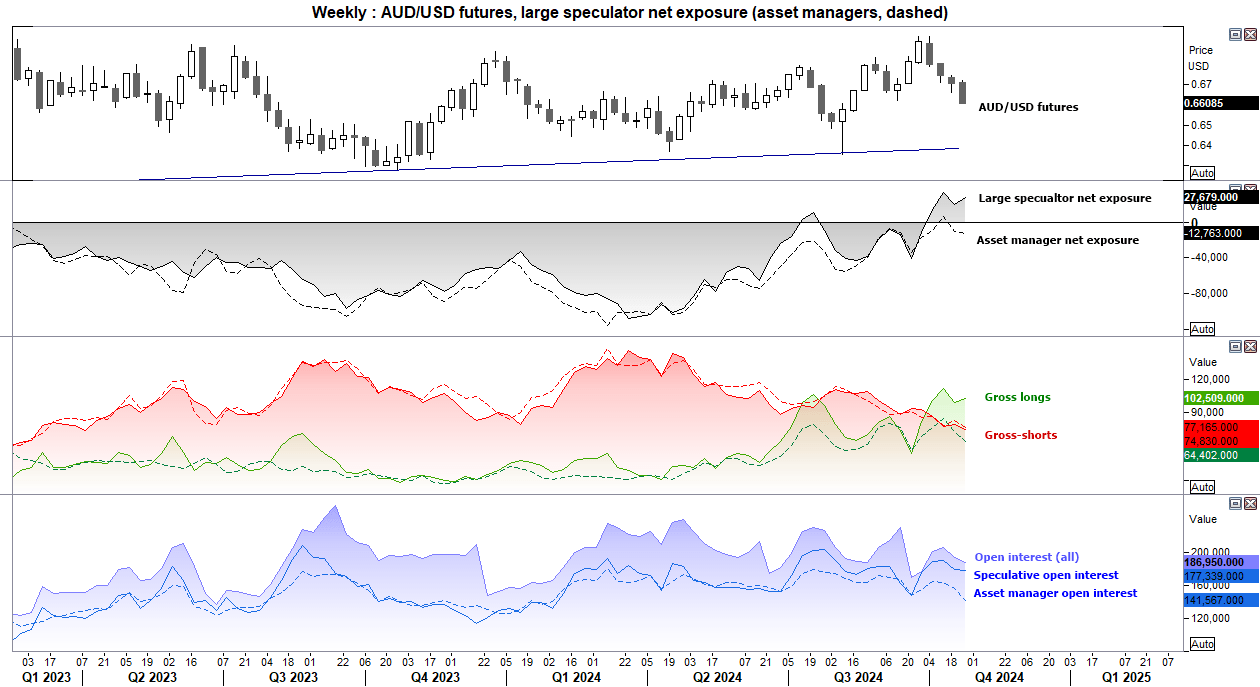
Large speculators may have had their fingers burned last week, given they increased gross longs and trimmed shorts in the week up to last Tuesday, only to see prices continue lower through to Friday’s close. Asset managers trimmed both longs and shorts and appear to be de-risking ahead of the US election. I suspect we’ll large speculators trimmed longs in the next report.
AUD/USD technical analysis
The weekly RSI (2) fell to its lowest level since late January at 6.5. While this warns of an oversold market, note that AUD/USD went on to print new lows in the first week of February before the price low was set. And while AUD/USD has already fallen for four consecutive weeks, it fell for five weeks at the beginning of the year, and six weeks in August 2023.
And if US data continues to outperform and polls suggest a Trump win, AUD/USD could easily fall for a fifth week.
The daily chart show prices closed beneath the September low 200-day SMA. Yet the daily RSI (14) is not yet oversold, and it looks like it wants to break beneath 66c. Bears may look to fade into any retracements towards the 200-day SMA (0.6627) or the 200-day EMA (0.6660) in anticipation for a move down to 0.6550, near a weekly VPOC (volume point of control), or even 0.6500 near a monthly VPOC.
-- Written by Matt Simpson
Follow Matt on Twitter @cLeverEdge


