
- It was a mixed performance for the Australian dollar last week, rising against the euro, pound and yen but lower against the Kiwi, US dollar, Swiss franc and Canadian dollar.
- It also etched out minor gains against the Chinese yuan and Singapore dollar
- The -0.7% fall on AUD/USD snapped a 3-week winning streak below several resistance levels

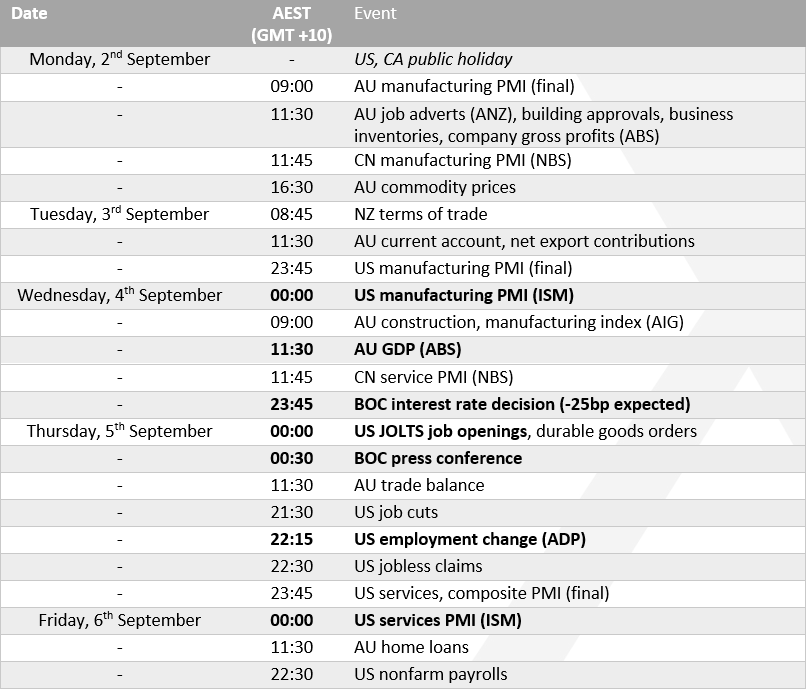
US economic data dominates the docket this week, with the slew of employment reports being the most notable. Traders are paying extra attention to jobs figures after Jerome Powell opened the door to multiple rate cuts, citing a labour market which is “no longer overheated”. With markets now applying a 61.3% probability of a 50bp cut in December (after a 25bp cut in September), traders may need to see a broader deterioration in the employment sector to avoid short-covering of the USD (which would be bearish for AUD/USD).
Take note that the JOLTS job openings, ADP payrolls and initial claims data could shape expectations for Friday’s NFP report. As could the ISM manufacturing and ISM services reports (the latter of which carries greater weight and lands on the even of NFP). Ultimately, we’re likely in for a volatile week, even if it could start slowly due to the public holiday in the US.
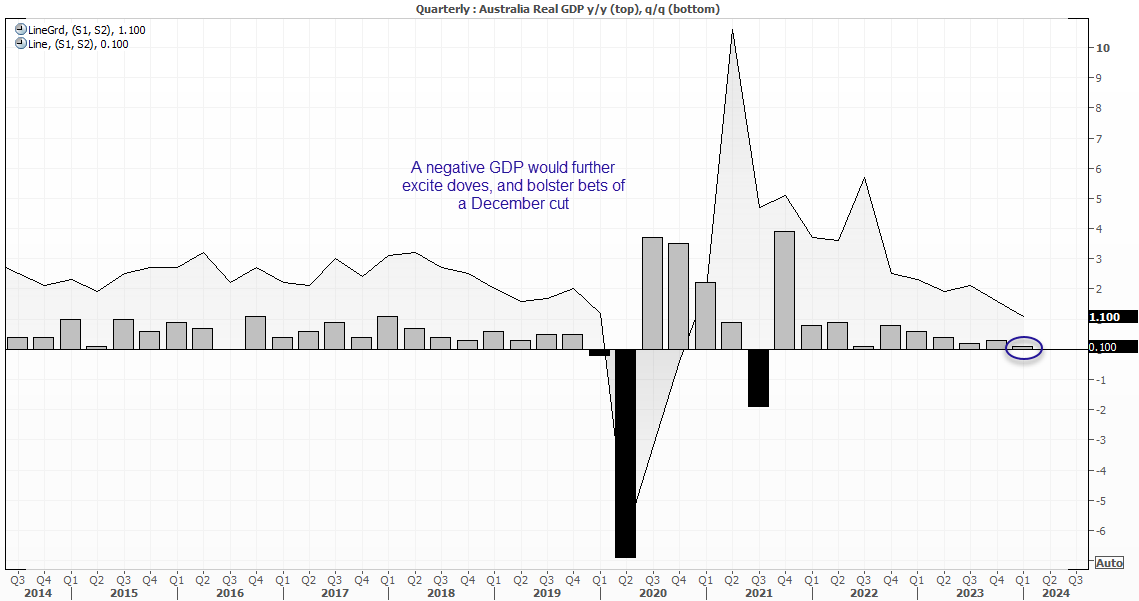
Australia’s Q2 growth figures are the main domestic event on Wednesday. Q1 growth was a sluggish 1.1% y/y, its slowest since the last negative print in Q4 2020. The 0.1% q/q rate was the slowest since Q3 2022. Needless to say, a surprise negative quarterly print will more than likely excite AUD/USD bears who are convinced the RBA are close to cutting rates. Yet I doubt an upside growth surprise will bolster bets of a hike, but simply push back expectations of a cut.
At the time of writing, RBA cash rate futures have fully priced in a 25bp cut in December, and another in April. We might see bets of the second cut brought forward with a weak GDP report, although keep in mind that the December cut seems to be contingent of markets continuing to back a 50bo Fed cut that same month.
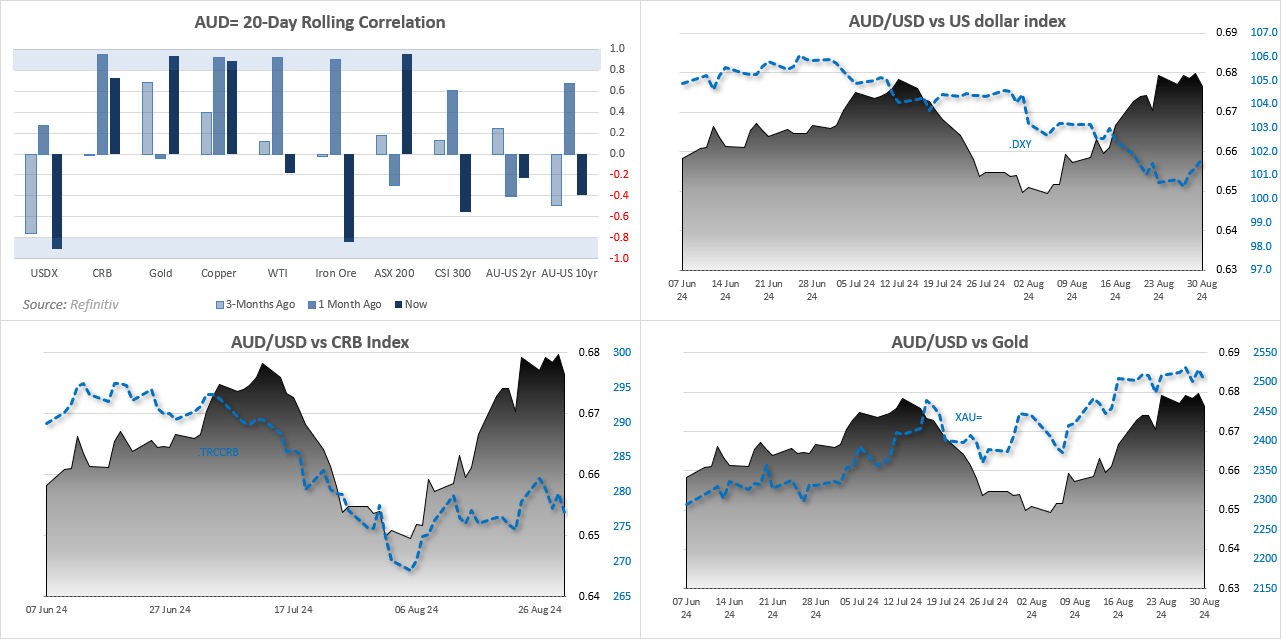
AUD/USD 20-day rolling correlation
- Commodities continued to retain a tight correlation with AUD/USD last week, particularly copper and gold
- The CRB index correlation has dropped from 0.93 to 0.72
- The strongly inverted correlation to the US dollar index has returned at -0.91
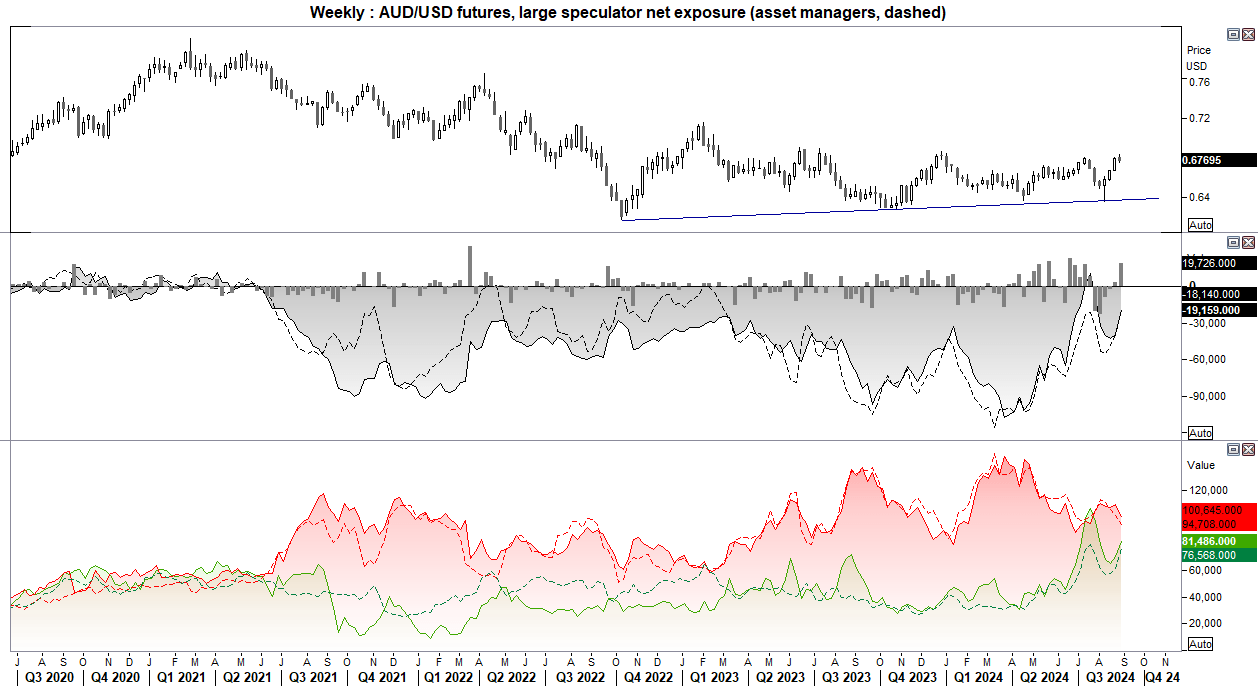
AUD/USD futures – market positioning from the COT report
- Net-short exposure among large speculators and asset managers decreased for a third week
- Shorts were trimmed and longs were higher, sending net-short exposure to around -18k for large specs and -19k for managed funds
- It was the fastest reductio of net-short exposure in 10 weeks
- But with the RBA unlikely to hike rates, it does not seem likely that traders will flip to net-long exposure soon
AUD/USD technical analysis
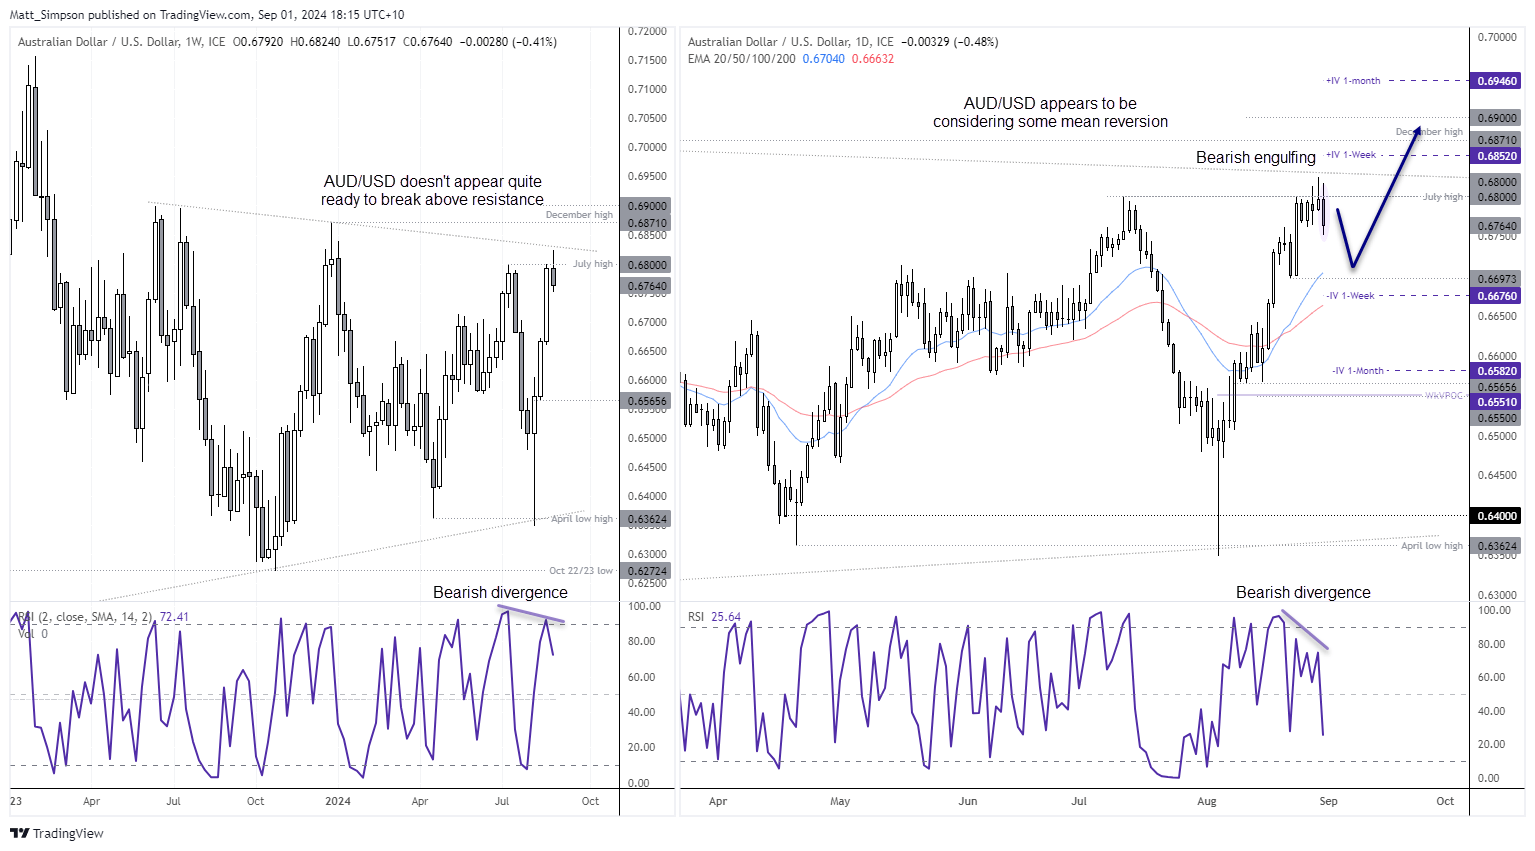
The Australian dollar formed a bullish engulfing month in August, with its 232.4% rally being its most bullish month since November. With a high-to-low range of 7.5%, it was the most volatile month since November 2024.
However, its 3-week rally failed to hold above 68c for long and reversed just beneath trends resistance from the June 2023 high. Its 1% range was its least volatile since January. Given my hunch that the US dollar bounce has further to go, a retracement lower on AUD/USD’s daily chart could be due.
The bias this week is to fade into low-volatility rallies towards last week’s high, in anticipation of some mean reversion towards the 20-day EMA, just below 67c.
-- Written by Matt Simpson
Follow Matt on Twitter @cLeverEdge


