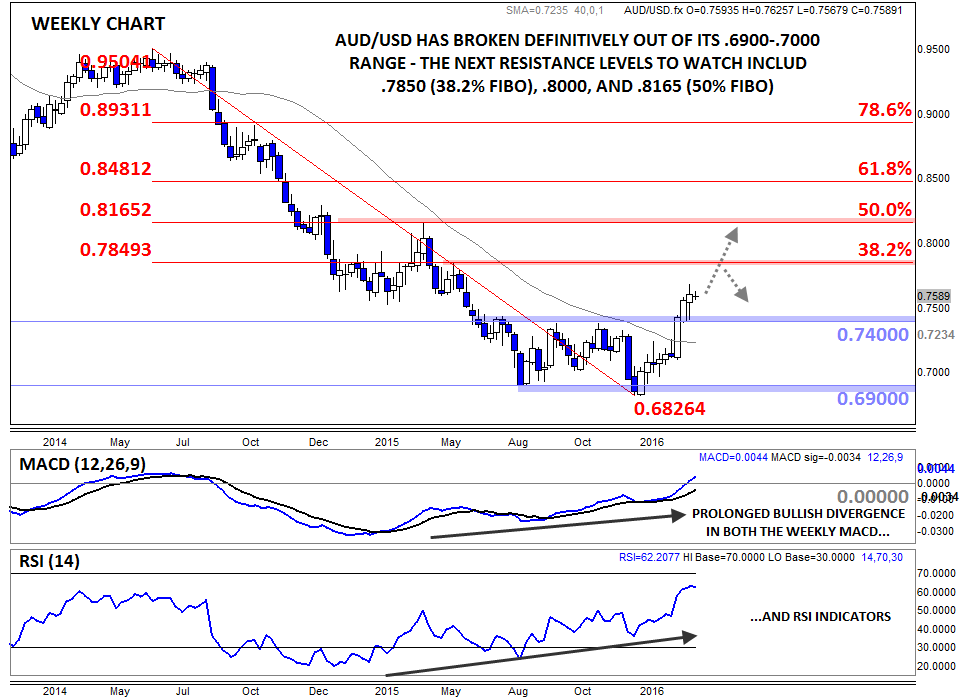
With markets essentially trapped in near-term stasis as traders wait for higher impact data, it’s a good time to take a step back and look at the longer-term technical picture on AUD/USD. For more than a year, from mid-2014 to mid-2015, the Aussie consistently lost value against the greenback, dropping more than 2,500 pips in the process.
Over the last half of 2015 though, something interesting happened: AUD/USD stopped going down. It might sound like a bit of a meaningless tautology, but for a downtrend to end, the market must first stop falling (or as my grandpa used to say, "if you find yourself in a hole, the first thing to do is to stop digging"). Long-term trends in the currency market are driven by massive, slow moving institutions like central banks, national governments, and international businesses, and as a result, they rarely reverse on a dime.
Nonethless, as AUD/USD consolidated in its .6900-.7400 range for upwards of six months, there were signs that the established downtrend was losing strength. As the weekly chart below shows, both the MACD and RSI indicators formed prolonged divergences with the AUD/USD exchange rate, showing waning selling pressure over H2 2015 and Q1 2016. Then, earlier this month, AUD/USD finally broke above the top of its range at .7400 and rates have already gone on to hit a high near .7700 as of Friday’s peak.
Of course, it would be premature to automatically assume that the pair will necessarily reverse the entire drop and trade back near .9500 any time soon, but as long as rates hold above .7400, there’s definitely a case for continued near-term momentum. To the topside, the next major levels to watch will be the Fibonacci retracements of the 2014-2016 drop at .7850 (38.2%) and .8165 (50%), as well as key psychological resistance at .8000. Only a break back below previous-resistance-turned-support at .7400 would shift the medium-term bias back to neutral.

Source: FOREX.com
For more intraday analysis and market updates, follow us on twitter (@MWellerFX and @FOREXcom)


