The bounce for the ASX nay end up being short lived, but price action suggests bulls might sneak in a 'last hurrah' over the near term. Meanwhile the China A50 continues to hold its ground and hint at a bounce of its own.

ASX 200 futures technical analysis:
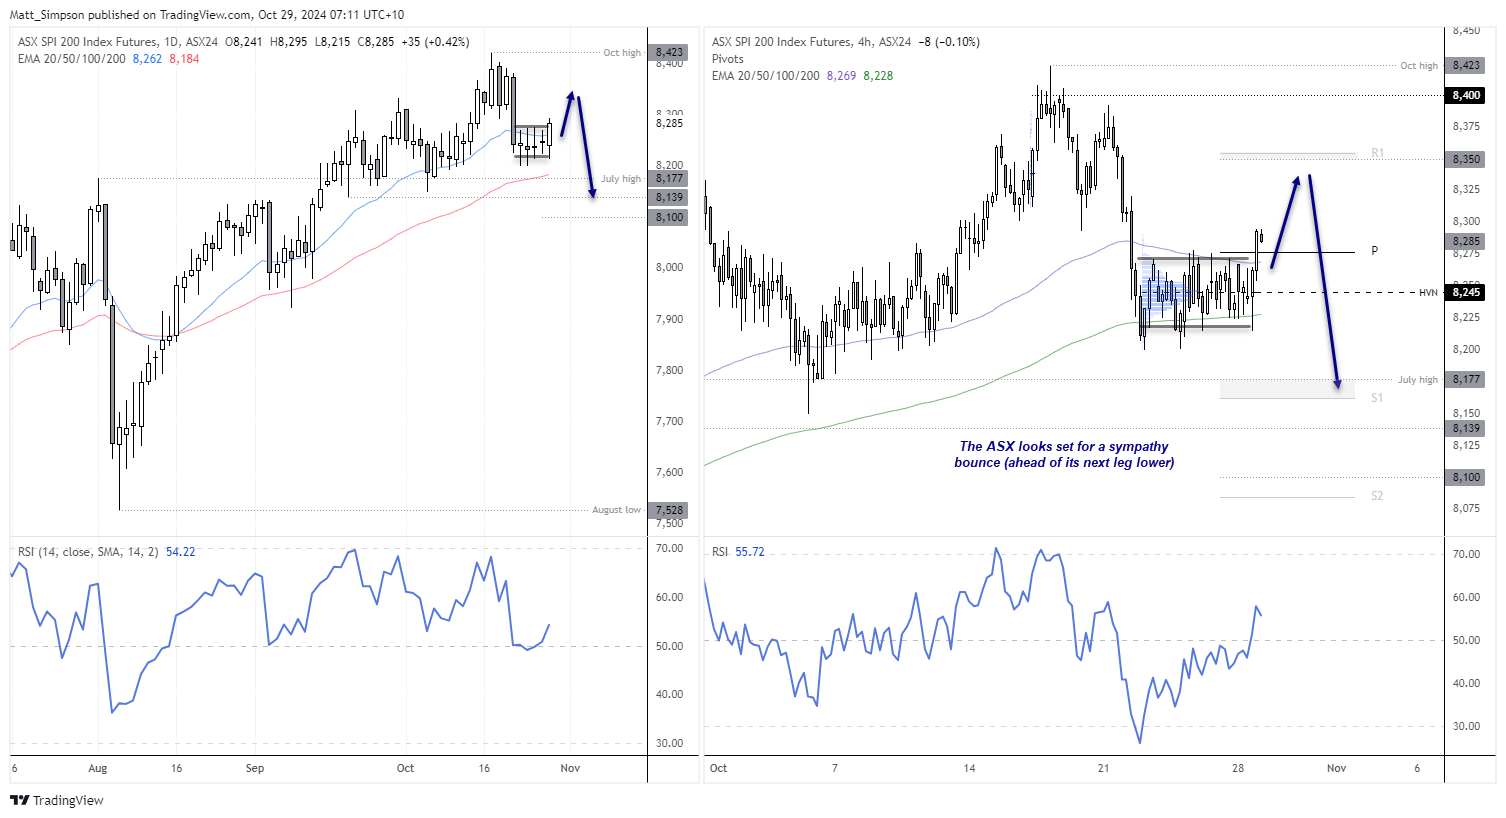
A week last Tuesday, the ASX 200 saw a large sellers bar which finally broke it from its choppy range near its all-time high. Subsequent price action was a series of doji’s, where the majority of their daily ranges overlapped one another at the lower end of the big seller’s bar. Yet overnight price action has helped ASX 200 futures close at its highest level of the sideways range, which to me hints at another attempt higher today (even if we could then go on to see new lows on the daily chart thereafter.
The 4-hour chart shows two strong buyers bars out of the choppy range. Bulls could seek dips towards the monthly pivot point (8276) or the high-volume node of the consolidation (8245). I’m not looking for any too heroic, as ultimately it looks like the ASX may have at least one more leg lower on the daily chart. But a move up to 8325 or even the weekly R1 (8350) might be achievable for a cheeky long punt.
Alternatively, bears could wait to see if prices can bounce, then identify swing highs to align themselves with another leg lower oh the daily chart towards 8177, 8140 or 8100.

China A50 technical analysis:
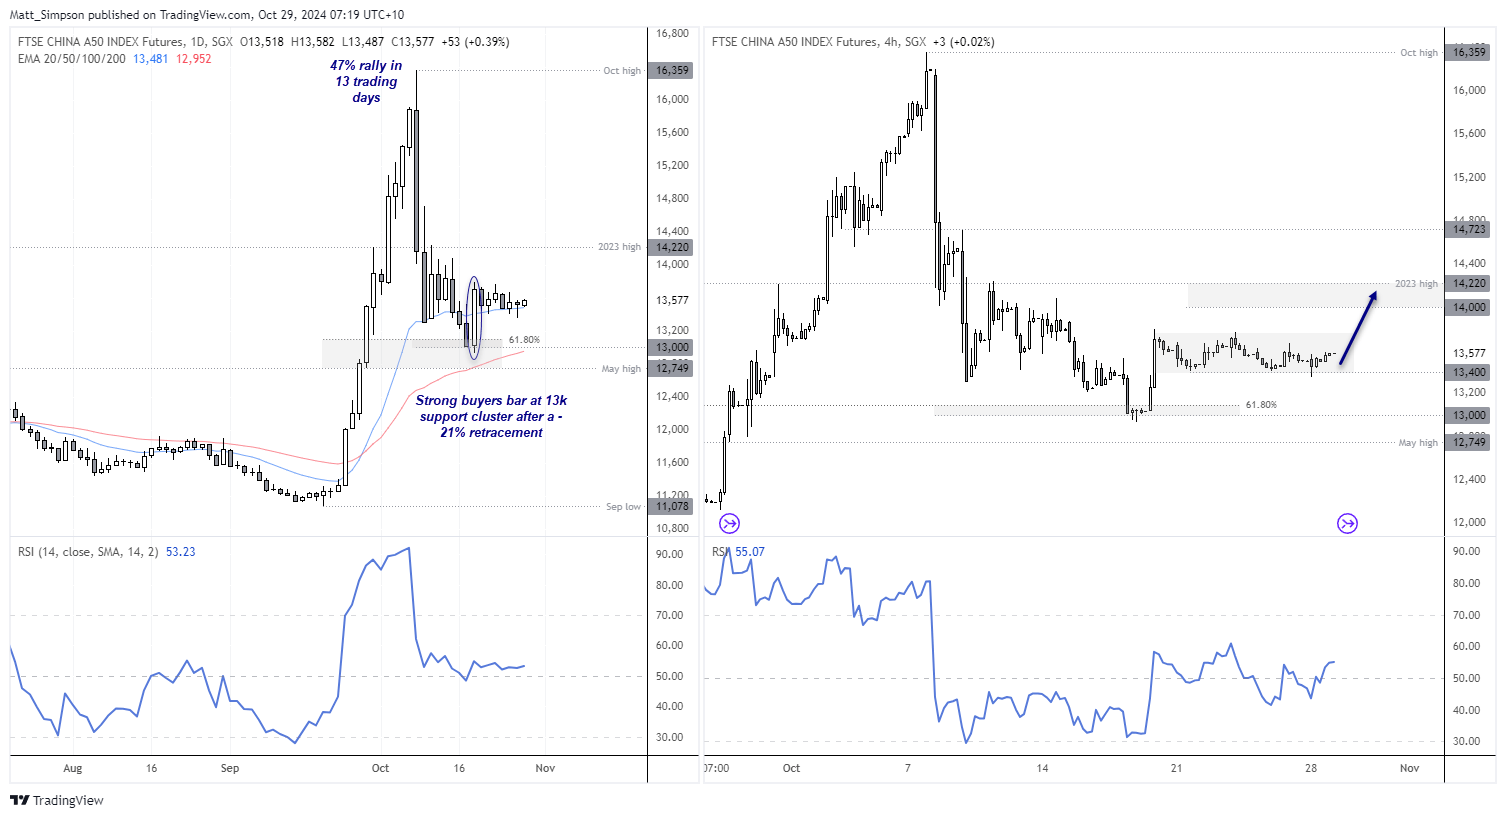
It is difficult to say if or when the China A50 could bounce, but it continues to look like up could be its next notable moves. At least over the near term.
The rally from the September low to October high was nearly 50% in less than three weeks. Although the market retraced over 20% of those rapid gains over the next eight trading days. Yet the strong buyers bar at 13k and the 61.8% Fibonacci ratio provided the first clue that the retracement had found an important low. And subsequent price action has remained in a tight range in the top third of that buyers bar to suggest demand remains in place (even if a breakout is yet to occur).
The 4-hour chart shows dips towards 13,400 are being supported. Bulls could seek dips towards that level in anticipation of a move to 14,000, or the 2023 high (14,220).

Events in focus (AEDT):
- 10:30 – JP unemployment, job/applications ratio
- 13:30 – SG unemployment
- 14:35 – JP 2-year JGB auction
- 20:30 – UK consumer credit, money supply, mortgage approvals
- 22:30 – US retail inventories, wholesale trade, goods trade balance
- 01:00 – US consumer confidence (Consumer Board), job openings (JOLTS)
- 01:30 – US GDPnow (Atlanta Fed)
View the full economic calendar
-- Written by Matt Simpson
Follow Matt on Twitter @cLeverEdge


