
FY 2025 Bitcoin Outlook: When Will the Bull Cycle Peak?
Bitcoin Key Points
- Bitcoin broke out of its post-halving consolidation to hit fresh record highs above $100K.
- Despite the big Q4 2024 rally, multiple indicators suggest that we still may be a way, in both time and price, from a cycle top in Bitcoin.
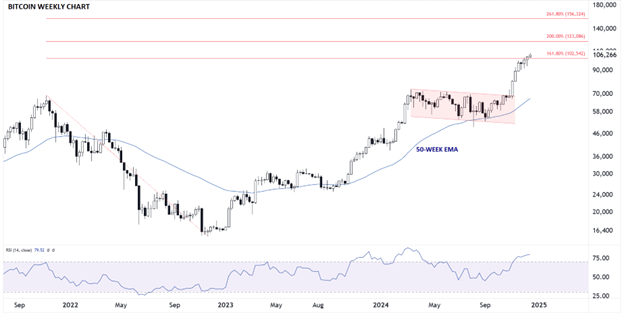
- To the topside, the next levels to watch are at $123K (the 200% extension of the 2021-2022 drop) and $156K (the 261.8% Fibonacci extension)
Bitcoin Q4 2024 in Review
You snooze, you lose as they say.
Our Q4 Bitcoin Outlook report was titled “Reasons Not to Sleep on the Lackluster Price Action,” and sure enough, shortly after publication, we saw Bitcoin break out of its prolonged sideways price action to explode to record highs above $108K as of writing in late December 2024. The proximate catalyst for the breakout was the “Red Wave” US presidential election that ushered in a far more crypto-friendly administration in the world’s largest economy.
As we head into 2025, traders are keen to see if the Trump Administration delivers on its promises and, as ever, how that impacts the price of the world’s largest cryptoasset.
Bitcoin 2025 Outlook
It took longer than some Bitcoin bulls would have preferred, but the cryptocurrency has kicked into gear in its historically bullish post-halving period.
For the uninitiated, the Bitcoin Halving is when the reward for mining new bitcoins is cut in half. This reduces the rate at which new bitcoins are created and thus, lowers the total supply of new bitcoins coming into the market. The halving tends to increase scarcity and historically has led to an increase in the price of bitcoin, though of course it's not guaranteed to do so in the future. As any Bitcoin bull will tell you, the April 2024 halving took the “inflation rate” of Bitcoin’s supply to below 1% per year, less than half of gold’s annual inflation rate.
Looking at my favorite chart, which I colloquially call “The Only Bitcoin Chart You'll Ever Need™”, previous Bitcoin halvings have marked the transition from the (yellow) post-bottom recovery rally stage to the (green) full-blown bull market stage. As Bitcoin continues to mature as an asset class, we’re likely to see smaller percentage moves in each stage even if the general pattern continues to hold (i.e. a 29X rally like we saw in 2016-17 would take Bitcoin over $2,000,000 for an absurd market capitalization of $40T), but the time-based projection for a ~1.5-year bull cycle to late 2025 is developing generally in-line with the 4-year cycle:

Source: TradingView, StoneX. Past performance is no guarantee of future returns.
As we noted in our last report, there are both macroeconomic and “fundamental” bullish arguments for Bitcoin beyond this simple cycle analysis, though it’s critical to watch how those catalysts evolve in the coming year and beyond.
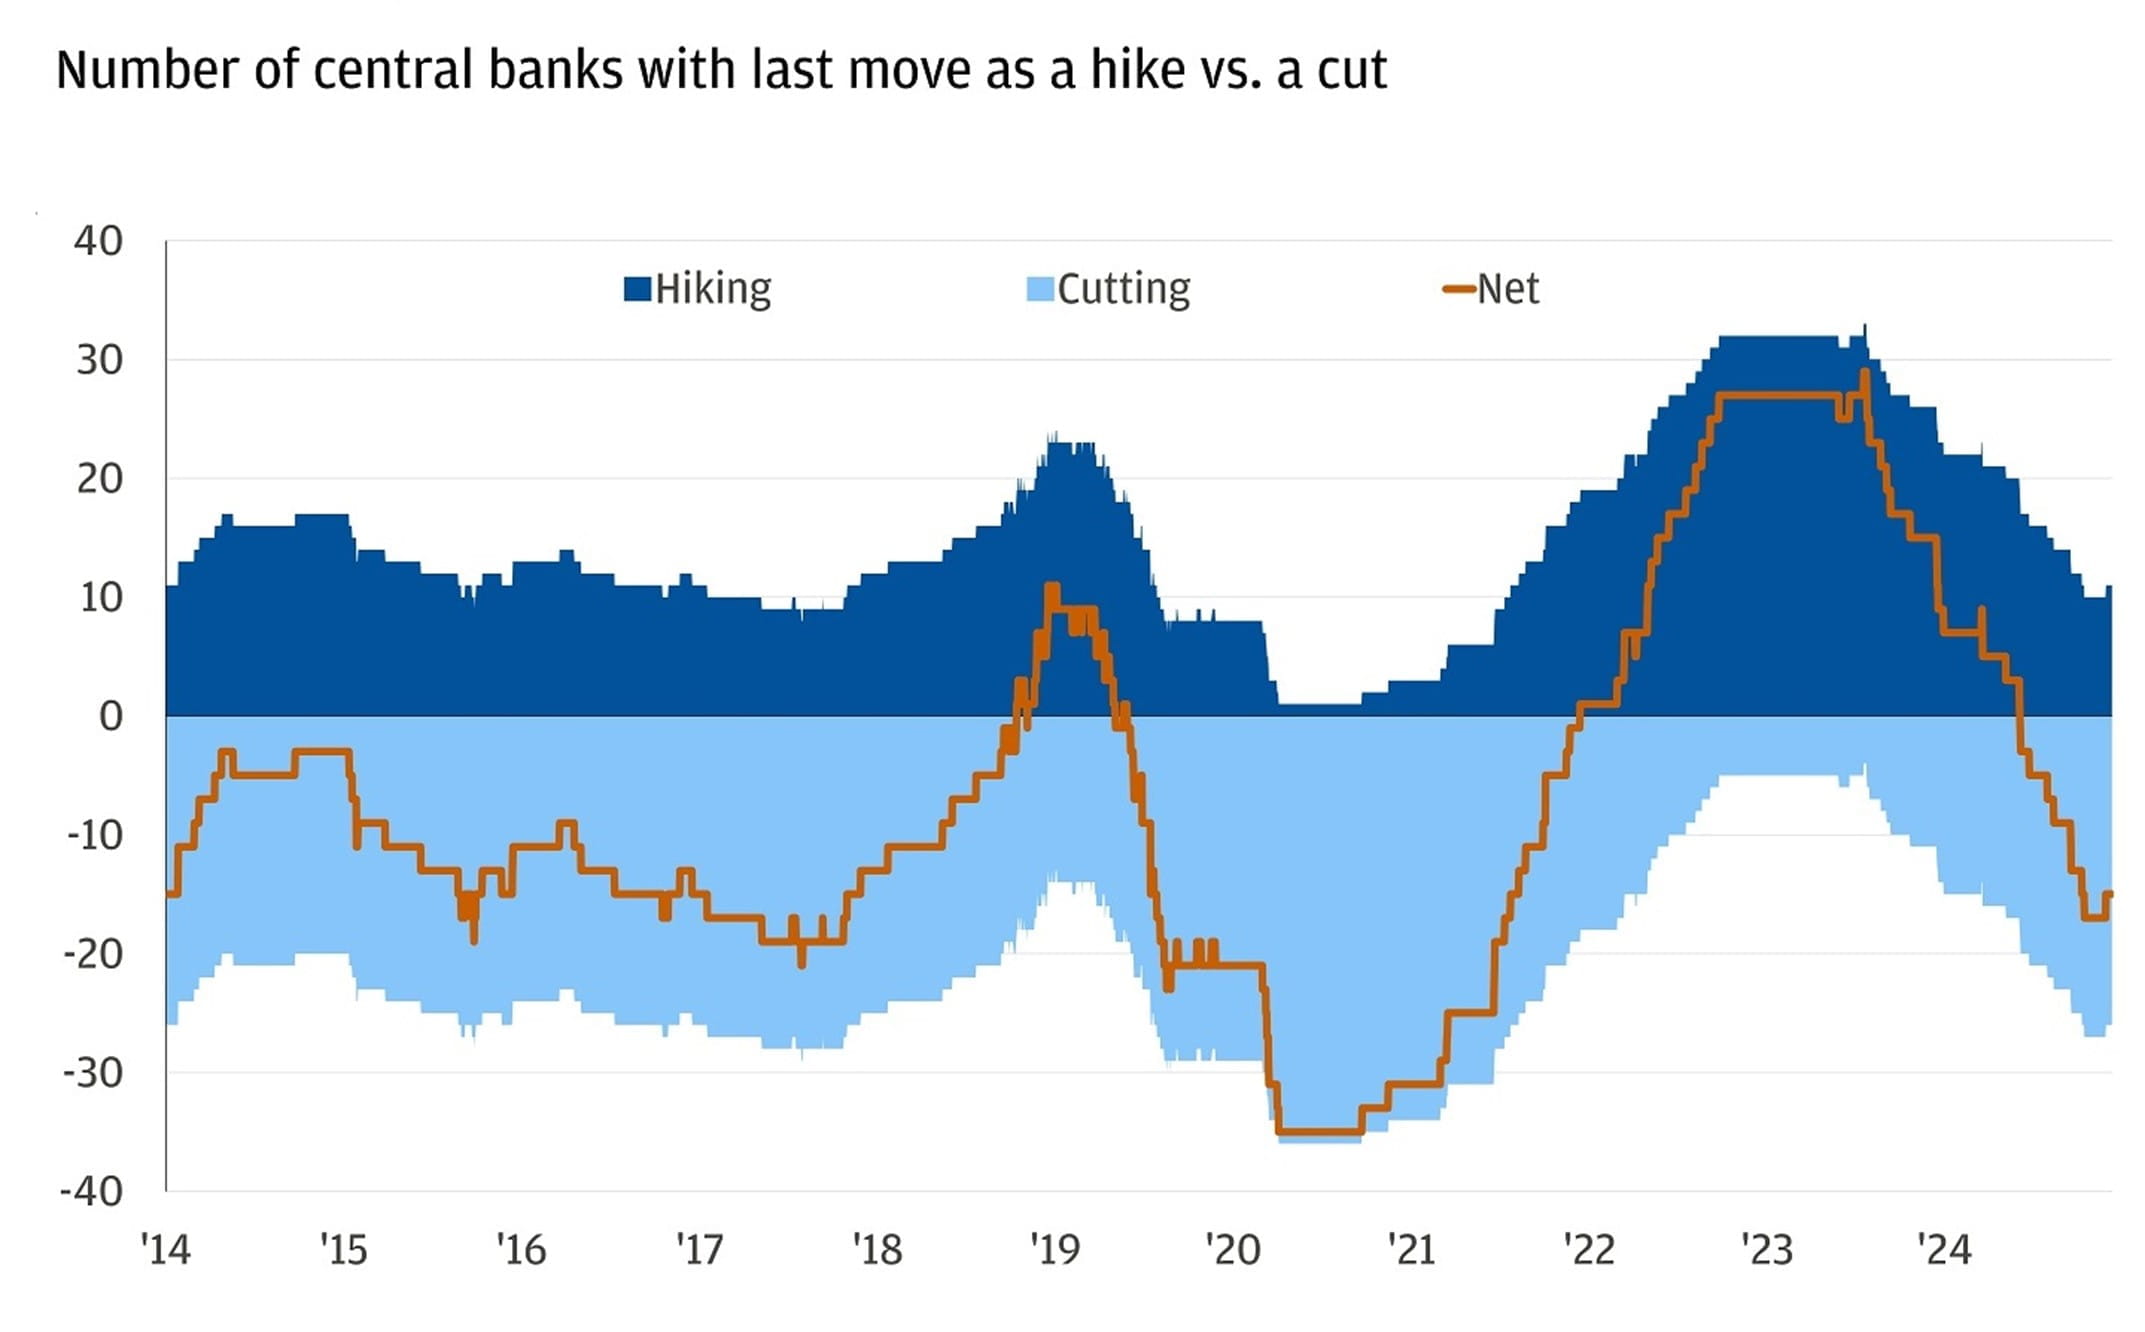
From a macroeconomic perspective, the monetary policy backdrop remains generally supportive, though we may be nearing a turning point for interest rate cuts. As the chart below shows, global central banks have still been cutting interest rates generally, but we have seen a small uptick in net interest rate changes in late 2024:
Source: Chase Bank
If the nascent trend toward interest rate hikes accelerates (especially if accompanied by pauses or small rate hikes among the major central banks – the Fed, ECB, BOJ, ECB, and PBOC) as central banks shift focus back to the risks of re-accelerating inflation, it could develop into a potential headwind for Bitcoin in the latter half of the year.
Likewise, the amount of fiat money in the financial system is also turning to a more stimulative direction. So-called “M2” is central banks’ estimate of the total money supply, including all the cash people have on hand, plus all the money deposited in checking accounts, savings accounts, and other short-term saving vehicles such as certificates of deposit (CDs).
After spiking above 6% in mid-2024, the year-over-year growth in global money supply has ticked down to closer to 2% as of writing:

Source: TradingView, StoneX.
One of the key narratives driving Bitcoin’s value is the idea of “hard money” or a hedge against fiat currency debasement, and if global money supply starts to contract in 2025, that could weigh on the cryptocurrency.
One other narrative driving Bitcoin higher has ben hopes of the US establishing a “National Strategic Reserve” holding up to 1M Bitcoin. Incoming President Trump has hinted at such a strategy, though it risks sowing doubt on the US dollar’s current status as the global reserve currency and therefore may not ultimately be enacted. Regardless, if we do see clear steps toward formally adding Bitcoin as a national reserve asset in the US, it could drive prices to new heights as other countries scramble to secure their own stashes of Bitcoin.
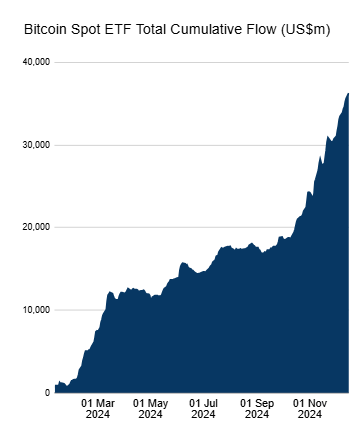
Speaking of large entities accumulating Bitcoin, the impressive inflow of “TradFi” institutional capital into spot Bitcoin ETFs has reaccelerated following the US election. In some of the most successful ETF launches of all time, total inflows into Bitcoin ETFs have exceeded $35B in less than a year:
Source: Farside Investors
As long as Bitcoin ETFs continue to pull in $1B+ in inflows per week, dips in Bitcoin itself are likely to remain shallow and short-lived as Wall Street “catches up” with smaller retail investors’ allocations to the Bitcoin and other cryptoassets.
Why Bitcoin (Still) Likely Has Not Reached a Cycle Top Yet
Over a longer-term horizon though, there are plenty of indicators that suggest we may still be a way, in both time and price, from a cycle top in Bitcoin.
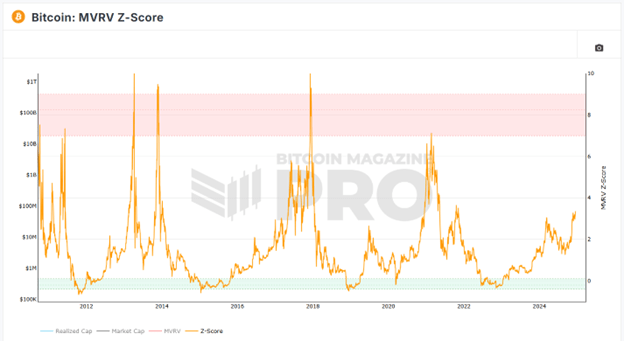
The MVRV (Market Value to Realized Value) Z-score, which compares the current price to the aggregate cost paid for all outstanding Bitcoin, has moved up from the < 1 level that has historically marked bear market bottoms in early 2023 to roughly 3 as of late December 2024.
However, as the chart above shows, previous cycle tops haven’t formed until this indicator reaches levels above 7, suggesting that we may still have further to rally before reaching a cycle top (though given Bitcoin’s limited historic record, it’s important to remember that the current cycle may not necessarily match previous patterns):
Source: Bitcoin Magazine. Past performance is not indicative of future returns.
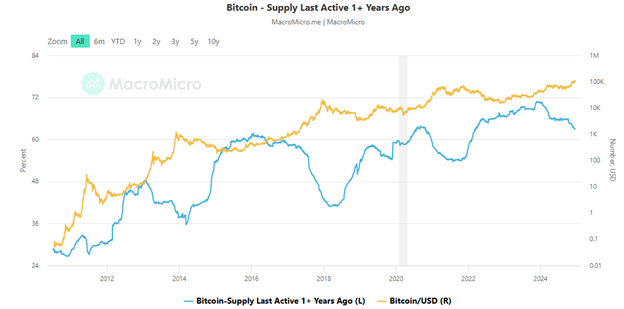
A final consideration is the behavior of long-term holders. As we’ve noted in previous outlooks, those who have held their Bitcoin for more than a year, almost tautologically, are not trying to make a “quick buck” off the cryptocurrency; rather they are more likely to be “true believers” or “HODLers” who are unlikely to sell unless they’re sitting on a truly massive gain.
As the chart below shows, the proportion of Bitcoin that has been held for at least a year started 2024 at record highs above 70% before seeing a notable decline to below 63% as of writing in late December. While a 7% drop may seem relatively small, it represents nearly 1.4M in marginal Bitcoin supply, offsetting some of the large ETF inflows. This measure, by definition, moves relatively slowly, but longer-term “HODLers” may continue to sell the cryptocurrency for as long as it continues to appreciate:
Source: MacroMicro.me
Of course, the catalysts we highlight in this report may not play out as expected – and to some extent, they may already be priced in so readers should always exercise caution when trading Bitcoin and other cryptoassets. As ever, it will be critical to monitor a broad swath of macroeconomic and crypto-specific metrics as the year develops.
Bitcoin Technical Analysis – BTC/USD Weekly Chart
Source: TradingView, StoneX.
Looking at the longer-term chart, Bitcoin has broken out of the high base/bullish flag pattern that constrained prices through the middle two quarters of 2024. After a breakout from a prolonged consolidation pattern, the strong one-way continuation rally through November and December is not surprising.
Moving forward, traders will be keen to see where the proverbial “rubber hits the road” when it comes to policy changes and general institutional acceptance in 2025. From a purely technical perspective, prices are “overbought” as of writing, raising the risks of a near-term pullback in the early part of 2025, but as long as the inflows into the asset class remain robust, we would expect traders to buy up shallow dips aggressively and ultimately push Bitcoin to $150K+ this year.
To the topside, the next levels to watch are at $123K (the 200% extension of the 2021-2022 drop) and $156K (the 261.8% Fibonacci extension of the same drop).To the downside, only a break back below the previous record highs in the $70K area would call the bullish cycle thesis into question.
-- Written by Matt Weller, Global Head of Research
Follow Matt on X: @MWellerFX
