Second Half of 2023 Market Outlook: Indices in play
- US - Can the rally in US stocks continue across H2?
- FTSE could struggle if the BoE hikes into a recession
- DAX outlook darkens as a deeper recession is expected
Can the rally in US stocks continue across H2?
US stocks have bounded northwards in H1, with the Nasdaq and the S&P 500 rising to 14-month highs. The run higher has been remarkable considering the backdrop as the Federal Reserve has continued with its most aggressive hiking cycle in decades.
The question is, where does the market go from here?
Supporting the bulls has been the resilience of the economy, the labour market, and the fact that inflation has started to cool. Relief following the debt ceiling agreement, an AI rally, and FOMO have also helped the indices push higher. These factors could continue to underpin equities in H2.
However, there is also a case for the bears.
Firstly, the narrow base of the rally is a cause for concern. The S&P 500 rise has been driven by fewer stocks than the dotcom bubble. The so-called magnificent 7 (TSLA, META, AMZN, MSFT, GOOGL, NVDA, APPL) have added $3.5 trillion in market cap in 2023, while the other 493 companies have together added around $0. A narrow-based rally means that it is vulnerable, and a slightly adverse event could spark a reversal. This doesn’t even need to be a black swan event.
Macroeconomic risks are set to shift from inflation to growth. Credit conditions are at levels seen in previous recessions and will tighten further, but the resilient consumer has delayed expectations of when the recession could start, if at all. However, it is worth noting that savings are running low, and credit card balances are rising. While the Fed could be close to the end of the hiking cycle, sticky core inflation means that rates could stay higher for longer. The Fed is not expected to start cutting rates until 2024.
Markets have priced in just one more rate hike in July and then a pause, supporting growth stocks but leaving some room for potential disappointment.
Where we go from here depends on how the economy holds up. Market performance after a peak in interest rates has been mixed and depends on the trajectory for growth & inflation.
When inflation comes under control & growth stabilises, equities may perform well, as was the case in 1995 and 2006. When inflation is more problematic, and a recession follows, equities can perform badly, like in 2000 and 1981.
Given the outlook for the macroeconomic backdrop, an extension of the bullish run-up in H2 looks less probable.
S&P500 outlook - technical analysis
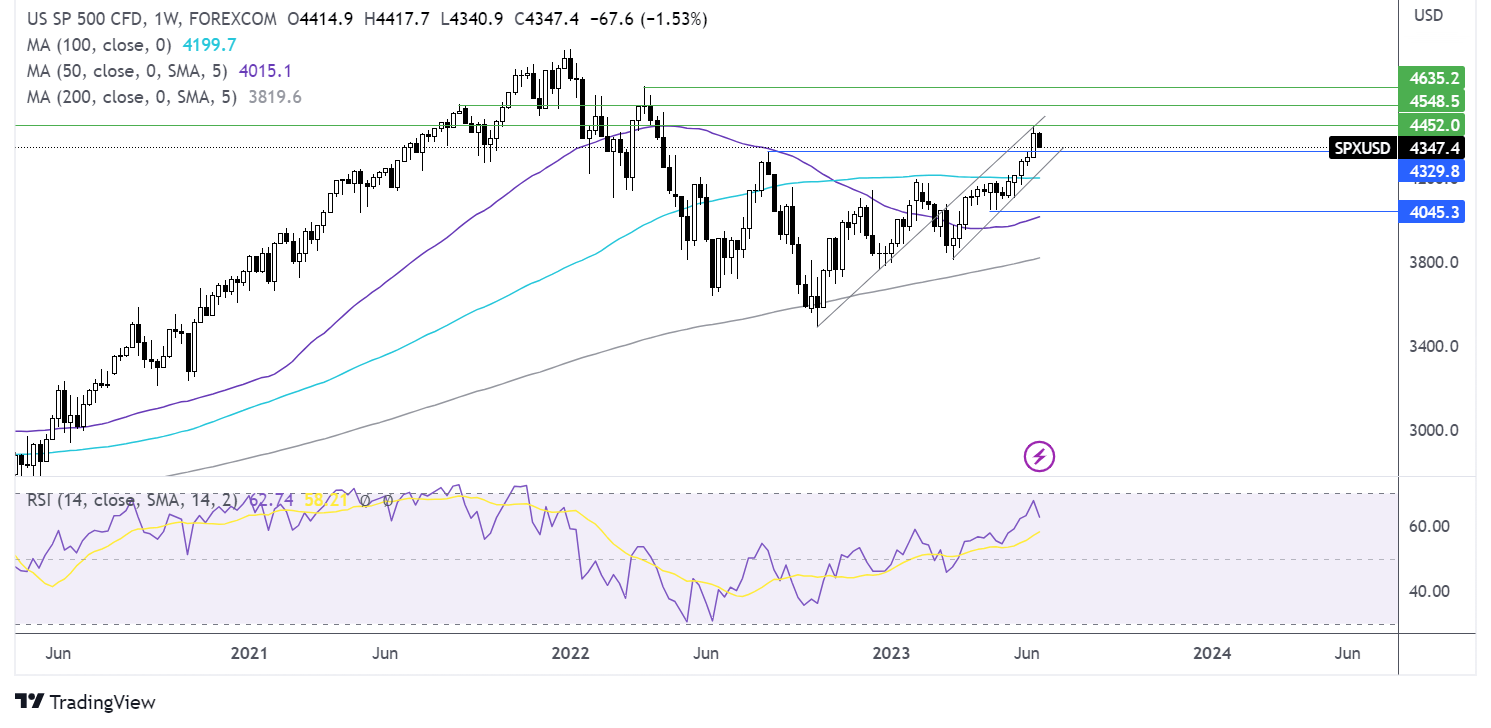
The S&P 500 trades within a rising channel on the weekly chart, hitting a high of 4448. This is the level to beat on the upside, with a break above here opening the door to 4545, the August 2021 and March 2022 high of 4635.
On the flip side, a break below 4325, the August high, brings 4255, the rising trendline support, into play, and 4200, the 100 sma. A break below 4050 creates a lower low.

Source: TradingView, StoneX
Nasdaq 100 outlook – technical analysis
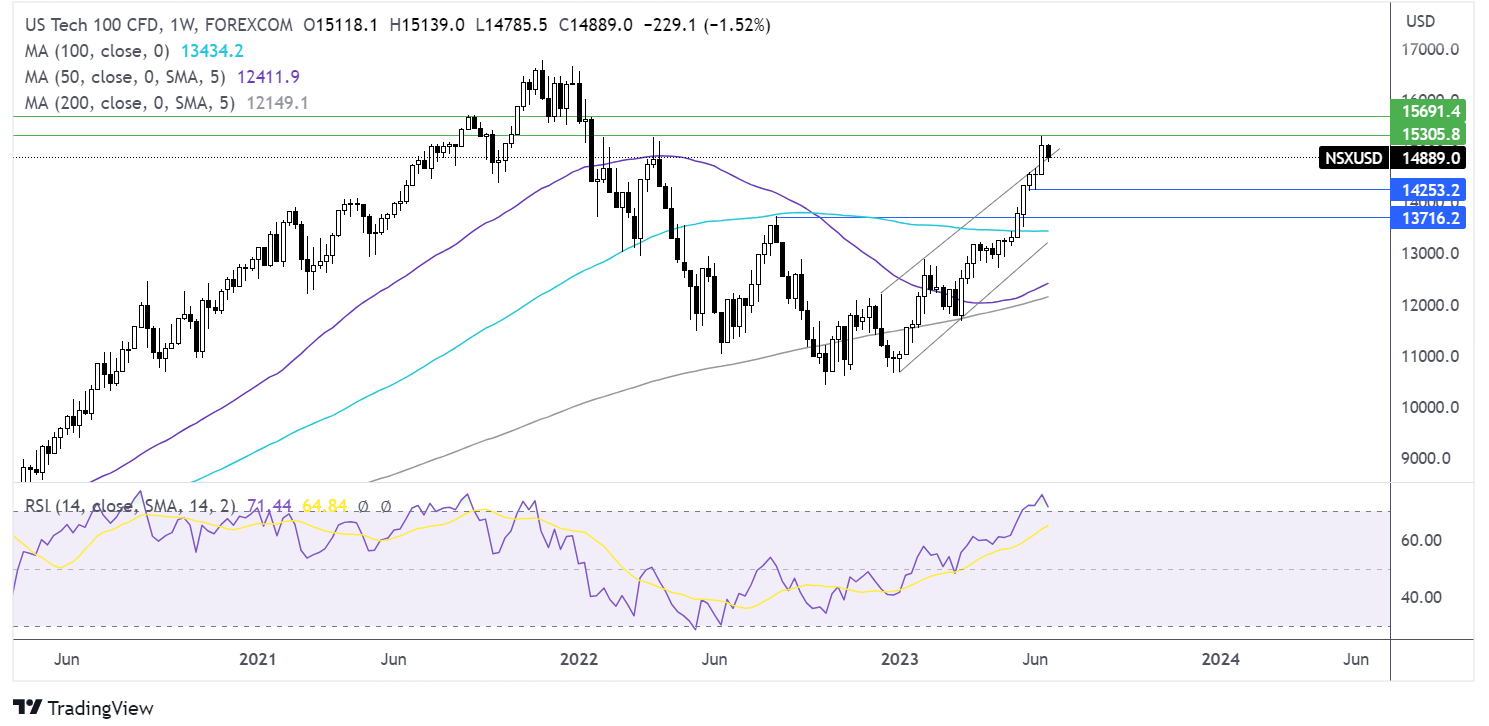
The Nasdaq broke out of the rising channel formation, running into resistance at 15287; this is the level on the upside that buyers will look to rise above to create a higher high.
However, RSI is overbought, so buyers should be cautious.
Sellers are testing the rising trendline support with a break below here, bringing 14230, the June low into play, ahead of 13724, the August high.

Source: TradingView, StoneX
FTSE could struggle if the BoE hikes into a recession
The FTSE rose to a record high towards the start of the year, as the gloomy forecast from the start of the year didn't play out. The consumer proved more resilient than expected, despite double-digit inflation, thanks to solid wage growth, an energy price cap, and reviving confidence. In short, recession fears receded. Rising interest rates supported banks, and heavyweight miners and resource stocks were helped higher by optimism surrounding the reopening in China.
Those supportive factors have largely played out. The macro picture is turning gloomier as inflation has proved to be stickier than expected, and the recovery in China is losing momentum.
In the final MPC meeting of H1, the BoE surprised the market with a larger-than-expected 50 basis point hike to 5%. The market is now pricing in a 6.25% peak rate by February next year, a level which would tip the UK economy into recession and wipe 10% off house prices.
Housebuilders, banks and consumer discretionary stocks are likely to act as a drag on the FTSE. Miners and oil majors could also pull the index lower should the recovery in China continue to falter. Major Western banks have revised their outlook on China’s GDP downward after a series of weaker-than-expected data points across April and May.
However, it may not all be bad news. Chinese authorities have shown a willingness to step in and cut rates to stimulate demand. The question is how big they are prepared to go. So far, the market hasn’t been that impressed. More support from Beijing could keep these stocks supported.
Domestically, an announcement from Downing Street that banks have agreed to a 12-month delay on home repossessions will offer some support to the housing market and housebuilders but could be considered an additional risk for banks.
With a deteriorating outlook, higher highs in H2 are looking unlikely, and the path of least resistance could be lower. The FTSE may find support if the gloomier outlook pulls the pound lower. A weaker pound benefits the multinationals that makeup around 80% of the FTSE, owing to a favorable exchange rate.
FTSE outlook – technical analysis
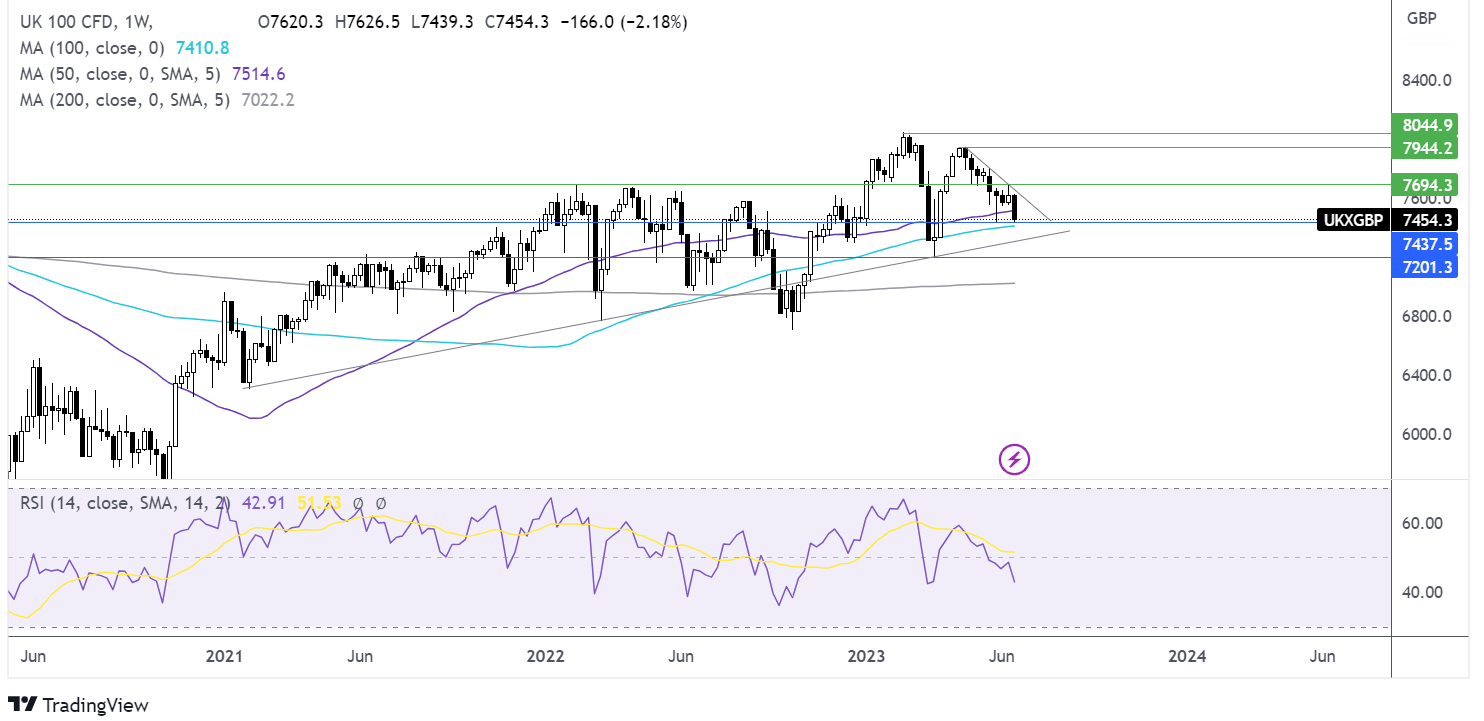
The FTSE has been trending lower since late April; it trades within a falling triangle on the weekly chart and is testing support at 7440. Given the aggressive break below the 50 sma and the price closing at the weekly low, sellers are hopeful of further losses.
Below 7440, the rising trendline support dating back to early 2021 comes into play at 7300, with a breakdown here opening the door to 7200, 2023 low.
Buyers will look for a rise over 7700 to negate the downtrend and bring 7944, the April high, into target.

Source: TradingView, StoneX
DAX outlook darkens as a deeper recession is expected
The DAX rose to a record high in June, boosted by stronger-than-expected earnings, easing energy prices and the re-opening boost from China. The DAX also benefitted from hopes that the economic downturn in Germany wouldn’t be as deep as initially feared.
Similarly to the FTSE, these supportive factors have largely played out. The economic outlook for H2 is darker, which doesn’t lend itself to fresh record highs. Earnings are expected to come under pressure, the manufacturing sector is contracting and economic sentiment is deteriorating.
While inflation in Germany is cooling faster than expected, at 6% heading into H2, it is still three times the ECB’s target rate.
The ECB is expected to hike rates again in July and potentially in September. As a result, credit conditions will tighten further. The IFO forecasts that the German economy will contract more than previously expected as sticky inflation is set to hit private consumption. The IFO now predicts that the economy will fall -0.4% this year, down from a previously forecast 0.1%. This contrasts with the eurozone, which is expected to grow 0.6%. Meanwhile, the IFO expects core inflation to rise to 6% this year.
The outlook suggests that a bullish run higher in stocks is less likely.
Factors that could support the DAX later in the year would be a faster-than-expected cooling in inflation, resilient economic growth, additional stimulus in China, and signs that the ECB and the Fed are considering a dovish pivot. However, this is likely to be a 2024 story.
DAX outlook – technical analysis
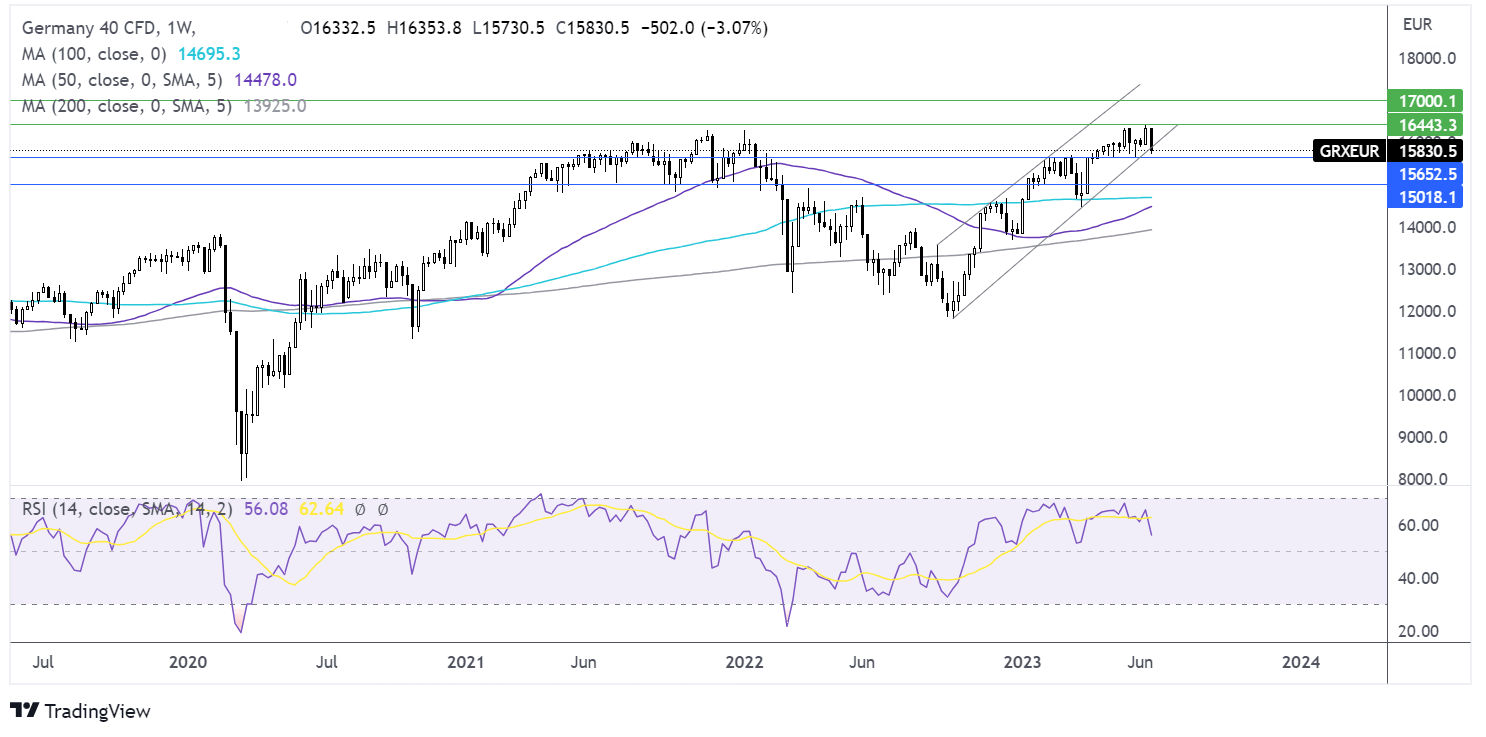
After a series of higher highs, the DAX is on the brink of breaking out of its rising channel dating back to early October. 15625, the May low, is the next level of support, with a break below here negating the near-term uptrend and opening the door to 15000.
On the upside, should bulls successfully defend the rising trendline support, buyers will look for a rise above 16430 for fresh all-time highs.

Source: TradingView, StoneX


